Big Data Analytics- PowerBI (PowerQuery & PowerMap) dashboards using HDInsight,Facebook data using Office 365
October 31, 2013 Leave a comment
In order to work on Big Data Analytics (ClickStream,Sentiment,RealTime) , its very important to work with PowerBI (PowerQuery & PowerMap) using Office 365. Microsoft Power Query Preview is an Excel add-in that enhances the self-service Business Intelligence experience in Excel by simplifying data discovery and access. Power Query enables users to easily discover, combine, and refine data for better analysis in Excel.
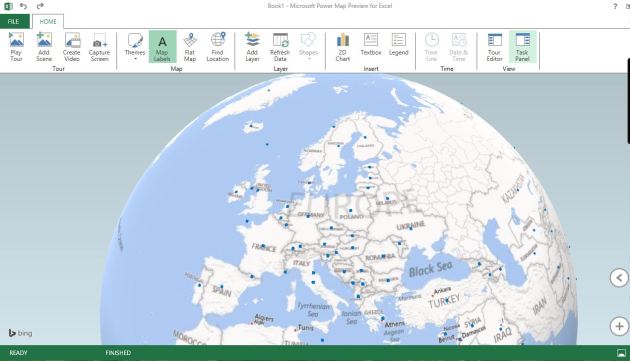
Power Map Preview for Excel 2013 allows you to plot geographic and temporal data visually, analyze that data in 3D, and create interactive tours to share with others.
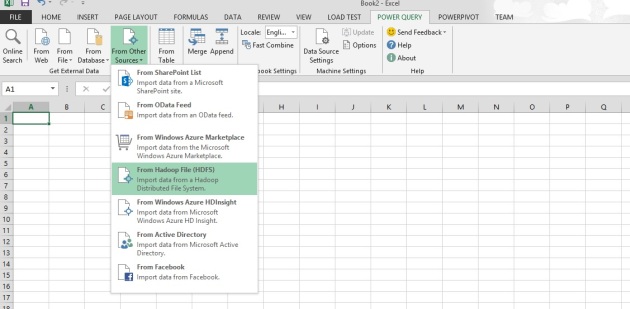
Let me show you a brief overview about Power Query after installing the addins for excel. open the PowerQuery tab & check the data importing options.
- Under Data sources option on PowerQuery , you will find options to import data from HDFS, Azure HDInsight , even from Facebook too.
- For this demo, I have selected , HDFS (Hadoop distributed File System) & Azure HDInsight option.
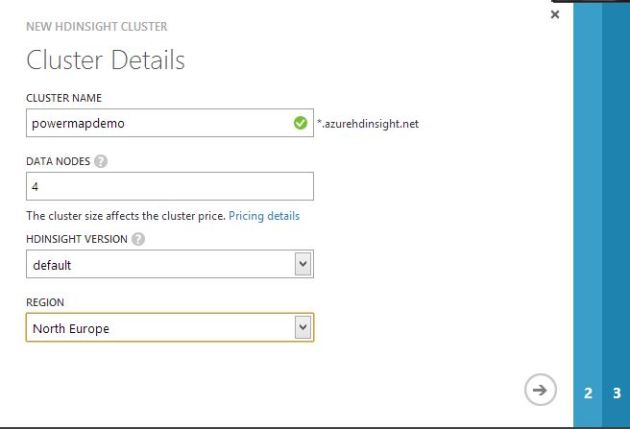
- Lets first create a HDInsight cluster in portal.
Next , provide final configuration values(Azure Storage Account Vaults [ASV] details) in order to create the cluster.
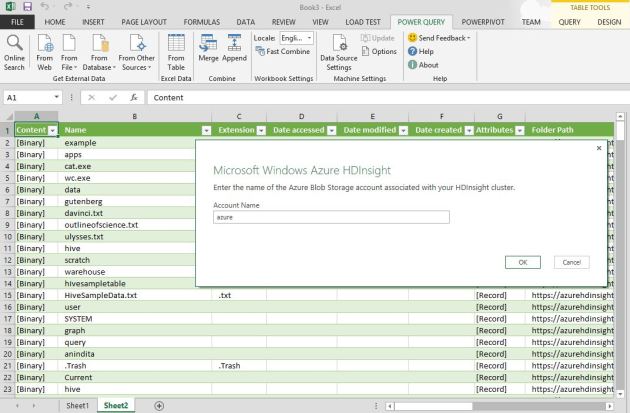
- Lets integrate the HDInsight cluster data with PowerQuery of Excel. Choose ‘Data Sources‘ as ‘Azure HDInsight Cluster‘.
- On Query Editor, specify the hdfs table data by selecting appropriate query & click on ‘done‘.
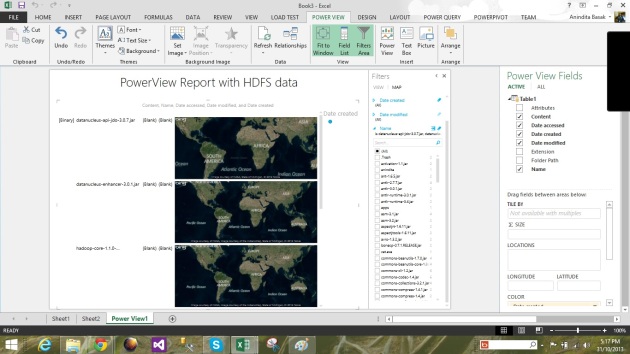
- Next, click on PowerView in order to create an interactive dashboard with PowerView using PowerQuery from HDFS data of Azure Storage Vault(ASV).
- To work with PowerMap for Office 365: after installing the powermap addin , lets choose the ‘Map‘ option from ‘insert’ tab of excel 2013.
- Created a sample report using World Bank’s data on Income Basis from Windows Azure Marketplace which has been imported into hdfs.
- Created a video tour of the PowerMap dashboard using World Bank’s statistical data of countries by income level. Access it here.





You must be logged in to post a comment.