Microsoft IoT Foundation: Realtime Tweets Streaming into Azure Stream Analytics with PowerBI & PowerBI Designer Preview


The Azure Stream Analytics(ASA) is one of the major component of Microsoft #IoT foundation which has got ‘PowerBI‘ as its output connector for visualization of realtime data streaming into Event hub to Stream Analytics hub, just one month back as ‘public preview’.

In this demo, we’re going to focus to end to end realtime Tweets analytics collecting through Java code using ‘Twitter4j’ library, then store it into OneDrive storage as .csv file as well as storing it into Azure storage as block blob. Then, sending realtime tweets streamed into Service Bus Event Hubs for processing , so, after creating the stream analytics job make sure that the input connector is properly selected as data stream for ‘event hub’, then process ASA SQL query with specific ‘HoppingWindow(second,3) & ‘SlidingWindow(Minute,10,5) with overlapping/non-overlapping window frame of data streaming.

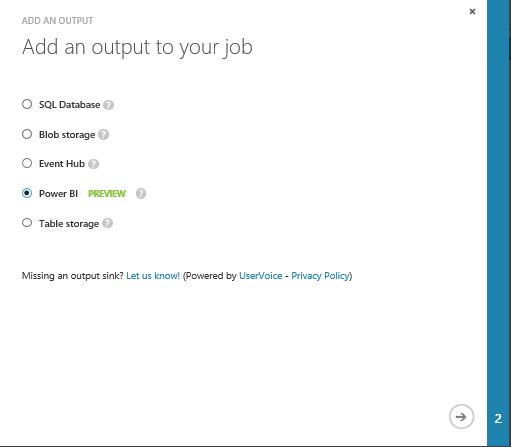
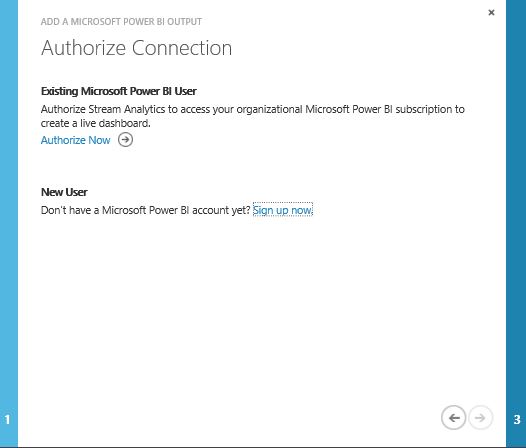
Finally , select the output connector as PowerBI & authorize with your organisational account. Once, your ASA job starts running, you would be able to see the powerbi dataset which you have selected as powerbi output dataset name, start building the ASA connected PowerBI report & Dashboard.

First, a good amount of real tweets are collected based on the specific keywords like #IoT, #BigData, #Analytics, #Windows10, #Azure, #ASA, #HDI, #PowerBI, #AML, #ADF etc.

The sample tweets are looks like this

DateTime,TwitterUserName,ProfileLocation,MorePreciseLocation,Country,TweetID
06/24/2015 07:25:19,CodeNotFound,France,613714525431418880
06/24/2015 07:25:19,sinequa,Paris – NY- London – Frankfurt,613714525385289728
06/24/2015 07:25:20,RavenBayService,Calgary, Alberta,613714527302098944
06/24/2015 07:25:20,eleanorstenner,,613714530112274432
06/24/2015 07:25:21,ISDI_edu,,613714530758230016
06/24/2015 07:25:23,muthamiphilo,Kenya,613714541562740736
06/24/2015 07:25:23,tombee74,ÜT: 48.88773,2.23806,613714541931851776
06/24/2015 07:25:25,EricLibow,,613714547975790592

Now,  the data is sent to event hub for realtime processing & we’ve written the ASA-SQL like this.

CREATE TABLE input(
DateTime nvarchar(MAX),
TwitterUserName nvarchar(MAX),
ProfileLocation nvarchar(MAX),
MorePreciseLocation nvarchar(MAX),
Country nvarchar(MAX),
TweetID nvarchar(MAX))
SELECT input.DateTime, input.TwitterUserName,input.ProfileLocation,
input.MorePreciseLocation,input.Country,count(input.TweetID) as TweetCount
INTO output
FROM input Group By input.DateTime, input.TwitterUserName,input.ProfileLocation,input.MorePreciseLocation,
input.Country, SlidingWindow(second,10)

Output

Authorize

Next, start build up the PowerBI report on PowerBI preview portal. Once you build the Dashboard with report by pinning the graphs, it would like something like this.

IoTAnalytics

Analytics

You could be able to visualize the realtime update of data like #total tweet counts on the specific keywords, #total twitterusername tweeted , #total tweetloation etc.

WorldwideTweet

In another demo, we’ve used the PowerBI Designer preview tool by collecting processed tweets coming out from ASA hub to ‘Azure Blob Storage’ & then picking it into ‘PowerBI Designer Preview’.

PBIDesigner

In latest PBI , we’ve got support of combo stacked chart, which we’ve utilized to depict #average tweetcount of those specific keywords by location & timeframe for few minutes & seconds interval.

TweetComboStacked

Also, you could support for well end PowerQ&A features as well like ‘PowerBI for Office 365’ which has natural language processing (NLP) backed by Azure Machine Learning processing power enabled.

like if I throw a question on these realworld streaming dataset on PowerQ&A

show tweetcount where profilelocation is bayarea & London, Auckland, India, Bangalore,Paris as stacked column chart

PowerQ&A

After that, save the PBI designer file as .pbix & upload into www.powerbi.com , under get data->Local File section. It has got support for uploading PBI designer file as well as data source connector.

PBI

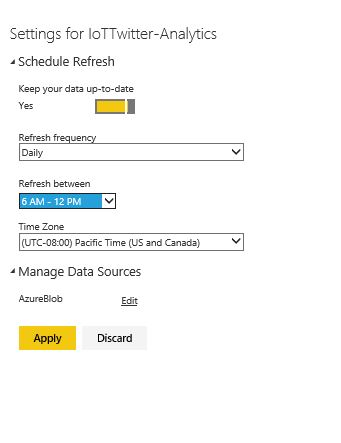
Upon uploading, built out the dashboard which has got facility of schedule refresh on preview portal itself. Right click on your PBI report on portal, select settings to open the schedule refresh page.

Settings

ScheduleRefresh

Here goes the realtime scheduled refresh dashboard of Twitter IoT Analytics on realtime tweets.

PBI-Portal

The same PBI dashboards can be visualized from the ‘PowerBI app for Windows Store or iOS’ . Here goes a demonstration.
WP_20150624_22_21_52_Pro

WP_20150624_22_22_20_Pro

Deployment of Hortonworks Data Platform (HDP 2.2.4) using Apache Ambari 2.0 on Azure Linux VM


Recently, Apache Ambari 2.0 is released with several exciting features like Ambari stacks, views & ambari monitoring , metrices. Using Ambari 2.0, HDP 2.2.4 can be deployed which contains default support of Apache Spark, Apache Knox, Ambari Metrices, Apache Ranger etc(apart of other hadoop ecosystem components).

In this following demo from this video, we’ve depicted the steps of provisioning an azure linux centos 6.5 node, configuration of the node due to deployment of ambari, installation of ambari, starting ambari server/agent & finally deployment of HDP.

What’s new in Azure SDK 2.5 & Visual Studio 2013 Update 4


Recently, after playing enough with Azure Stream Analytics , it’s time to move on with azure .net development & a new version of Azure sdk is published. Let’s have a quick overview on latest azure sdk.

First of all, lets download the sdk from webpi console, as directed ‘Microsoft Azure SDK 2.5 for .NET(VS 2013)

webpi

In this edition, there are few new components added like as:

i) EnvironmentTools.VS.msi

ii) HiveODBC32.msi

iii)HiveODBC64.msi

iv) Microsoft.Azure.HDInsightTools-x64.msi

v) Microsoft.Azure.HDInsightTools-x86.msi

so on…

Components

Now, after installing sdk 2.5 , lets start with Visual Studio 2013.

Vs2013-sdk2.5

Expand on ‘QuickStart’ under ‘Cloud’ & start exploring options to create AppService , Compute & DataService directly from VS 2013 /2012 itself.

sdk2.5


The default ‘DataBlobStorage1’ sample would be created in VS to create blob container, create a block blob/page blob, upload a new blob , delete a blob (all basic CRUD operations on blob using REST)

BlobStorage-VS

Next, the major improvements is done on Azure HDinsight shell integration into Visual Studio onto which you can now run your custom Hive table queries on HDFS of HDInsight clusters. Lets create a sample Hive query file on VS 2013.

Lets move into HDInsight tab on left side of VS installed menu & select HDInsight’ & select ‘HiveApplication’ to start with new Hive-ql. For this demo, I am selecting Hive Sample from VS.

HDI


On selecting Hive sample, I would be able to open the sample Hive queries on ‘weblogAnalysis.hql‘  & ‘sensordataAnalysis.hql’ from Azure HDinsight cluster.

Here goes a sample weblogAnalysis.hql:

DROP TABLE IF EXISTS weblogs;
— create table weblogs on space-delimited website log data.
— In this sample we will use the default container. You could also use ‘wasb://[container]@[storage account].blob.core.windows.net/Path/To/Data/’ to access the data in other containers.
CREATE EXTERNAL TABLE IF NOT EXISTS weblogs(s_date date, s_time string, s_sitename string, cs_method string, cs_uristem string,
cs_uriquery string, s_port int, cs_username string, c_ip string, cs_useragent string,
cs_cookie string, cs_referer string, cs_host string, sc_status int, sc_substatus int,
sc_win32status int, sc_bytes int, cs_bytes int, s_timetaken int )
ROW FORMAT DELIMITED FIELDS TERMINATED BY ‘ ‘
STORED AS TEXTFILE LOCATION ‘/HdiSamples/WebsiteLogSampleData/SampleLog/’
TBLPROPERTIES (‘skip.header.line.count’=’2’);


Before proceeding with the realtime hive queries, we need to make sure that the Azure HDI cluster is already provisioned & it might be either a simple Hadoop HDI cluster, HBase HDI cluster or Storm HDI cluster to build hive tables on top of it.

sensorhql-vs

There’s a new option came out for Azure HDI cluster to add custom powershell scripts while provisioning a HDI cluster using azure portal. Also, new additions of HDI cluster is exploration of R(official cran packages) & Apache Spark on hdinsight hdfs cluster which will be covered with demo next.

An OverView of HDInsight (Hadoop+HBase) with Integrated PowerShell along with R


Recently, while started the work with Predictive Analytic s with Machine Learning & R , felt the necessity of integration of Azure HDInsight-HBase with Azure ML features. In this demo, we ‘ll go through few basic understandings of operations on HDInsight(Hadoop) on Azure with PowerShell 0.8.6.

To start with, first we need to create an azure storage account which must be in same datacenter (e.g SouthEast Asia for this demo) of HDInsight cluster.


StorageAccount

You need also create a blob container & storage context object in order to copy raw data (e.g Click Stream data, log data, machine-sensor data) to local drive to azure storage account.


StorageAcc


To Copy data from local drive to Azure Storage container , use the following script.

CopyDataToBlob


Next, we need to provision the HDInsight cluster , for that need to execute the following script.

ProvisioningCluster

Upon, executing the script, the cluster provisioning is started from accept, configuring , provisioning phase. You need to assign the username & password manually.

HDInsightProvision

ClusterProvisioned


Next, check in Azure management portal after few mins, the provisioning have been started.

Portal

Details of HDInsight cluster provisioning along with running HQL queries is stored in my github repository. You can get it here.

Now, HBase columnar storage is available as a part of hadoop cluster from HDInsight offerings, so while provisioning cluster from portal , you need the corresponding cluster type – HBase or Hadoop.

HBase

Both of cluster type(either HBase or Hadoop) of HDInsight 3.1 is completely based of pure Hortonworks HDP 2.1 clusters which contains the hadoop components of the following version.

  • Apache Hadoop 2.4
  • Apache HBase 0.98.0
  • Apache Pig 0.12.1
  • Apache Hive 0.13.0
  • Apache Tez 0.4
  • Apache ZooKeeper 3.4.5
  • Hue 2.3.1
  • Storm 0.9.1
  • Apache Oozie 4.0.0
  • Apache Falcon 0.5
  • Apache Sqoop 1.4.4
  • Apache Knox 0.4
  • Apache Flume 1.4.0
  • Apache Accumulo 1.5.1
  • Apache Phoenix 4.0.0
  • Apache Avro 1.7.4
  • Apache Mahout 0.9.0
  • Third party components:
    • Ganglia 3.5.0
    • Ganglia Web 3.5.7
    • Nagios 3.5.0


    For Big Data analytics world , one of the most fine-grained language that supports now with Azure ML is R. You can install R official packages for Windows, Linux & OS X, also for official project perspective , use R IDE.

    R Packages:

    R packages are self-contained units of R functionality that can be invoked as functions. A good analogy would be a .jar file in Java. There is a vast library of
    R packages available for a very wide range of operations ranging from statistical operations and machine learning to rich graphic visualization and plotting. Every package will consist of one or more R functions. An R package is a re-usable entity that can be shared and used by others. R users can install the package that contains the functionality they are looking for and start calling the functions in the package. A comprehensive list of these packages can be found at http://cran.r-project.org/ called Comprehensive R Archive Network (CRAN).

    Data Modelling with R:

    Regression: In statistics, regression is a classic technique to identify the scalar relationship between two or more variables by fitting the state line on the
    variable values. That relationship will help to predict the variable value for future events. For example, any variable y can be modeled as linear function
    of another variable x with the formula y = mx+c. Here, x is the predictor variable, y is the response variable, m is slope of the line, and c is the
    intercept. Sales forecasting of products or services and predicting the price of stocks can be achieved through this regression. R provides this regression
    feature via the lm method, which is by default present in R.
    Classification: This is a machine-learning technique used for labeling the set of observations provided for training examples. With this, we can classify
    the observations into one or more labels. The likelihood of sales, online fraud detection, and cancer classification (for medical science) are common
    applications of classification problems. Google Mail uses this technique to classify e-mails as spam or not. Classification features can be served by glm,
    glmnet, ksvm, svm, and randomForest in R.
    Clustering: This technique is all about organizing similar items into groups from the given collection of items. User segmentation and image
    compression are the most common applications of clustering. Market segmentation, social network analysis, organizing the computer clustering,
    and astronomical data analysis are applications of clustering. Google News uses these techniques to group similar news items into the same category.
    Clustering can be achieved through the knn, kmeans, dist, pvclust, and Mclust methods in R.

    Recommendation: The recommendation algorithms are used in recommender systems where these systems are the most immediately recognizable machine learning techniques in use today. Web content recommendations may include similar websites, blogs, videos, or related content. Also, recommendation of online items can be helpful for cross-selling and up-selling. We have all seen online shopping portals that attempt to recommend books, mobiles, or any items that can be sold on the Web based on the user’s past behavior. Amazon is a well-known e-commerce portal that generates 29 percent of sales through recommendation systems. Recommender systems can be implemented via Recommender()with the recommenderlab package in R.


Automated Provisioning of Azure Virtual Machines with PowerShell using Runbook


Recently, I have been adding a lot of energy towards the latest additions of Azure family, like Automation API, Scheduler, Machine Learning (ML) on HDInsight, StorSimple (checking it from today itself in management portal). With my utmost curiosity researched & noted down a few points to be taken care of while writing custom IaaS PowerShell scripts to provision fresh Azure VM image using traditional Azure cmdlets.

$adminPassword = '[YOUR-PASSWORD]'
$vmname = 'mytestvm1'
New-AzureQuickVM -Windows -ServiceName $cloudSvcName -Name $vmname -ImageName $image -Password $adminPassword


Most of us got familiar with these script while issue happens providing the $imagename , for Windows Server 2012 DataCenter , the command would be like this:

$cloudSvcName = '[Your Cloud Service Name]'
$vmname = '[Name of VM]'
$availabilityset = '[Name of Availability set]' (Optional)
$admin = '[Your Username]'
$password = '[Your Password]'
New-AzureQuickVM -Windows -ServiceName $cloudSvcName -AvailabilitySetName $availabilityset  -Name $vmname -ImageName "
bd507d3a70934695bc2128e3e5a255ba__RightImage-Windows-2012-x64-v5.8.8.12" -AdminUsername $admin –Password $password 

After provisioning , you would be able to see the default endpoints.
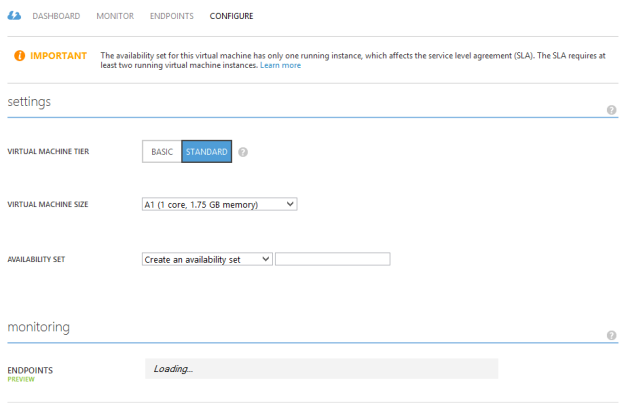
Remote EndpointEndPoint

The default configuration of VM would be (A1 1 core, 1.75 GB Memory) with Standard Tier in order to put multiple VMs on same load-balanced endpoint & ease autoscaling .

In next article, I would travel around PowerShell automation scripts using Run book utilizing Azure VM, Storage & Cloud services.

Resources on Design Pattern Guidelines on Azure & HDInsight


There are few good resources are available from P&P team. There is a good book on Big Data Solutions using Windows Azure which is availble in Codeplex. The book covers the details of the HDInsight version released till May 2013.

This month’s release contains several designing guidelines on Azure “Asynchronous Messaging“, “Cache-aside“, “Autoscaling” etc.

The resources are available along with full source code.

Big Data Azure book


An Introduction to Hadoop, MapReduce, Hive, HBase, Sqoop on Windows Azure


In today’s Hadoop world , MapReduce can be seen as a complement to an RDBMS. MapReduce is a good fit for processes that need to analyse the whole dataset, in a batch operation, specially for ad-hoc analysis. An RDBMS is good for point queries or updates, where the dataset has been  indexed to deliver low latency retrieval and update times of a relatively small amount of  data. MapReduce suits applications where the data is written once , and read many times, whereas a relational database is good datasets that are continually updated.

Traditional RDBMS                                    MapReduce

Data Size: Gigabytes                                         Petabytes

Access: Interactive and Batch                     Batch

Updates: Read and write many times         Write once , read many times

Structure: Static schema                                  Dynamic schema

Integrity High                                                      Low

Scaling     Nonlinear                                           Linear

  • MapReduce & RDBMS is the amount of  structure in the datasets that they operate on. Structured data is the data that is organised into entities that they have a defined format, such as XML documents or database tables that conform to a particular predefined schema. This is the realm of the RDBMS.
  • Semi Structured data is looser, and through there may be a schema, is often ignored, so it may be used only as a guide to the structure of the data.
  • Unstructured data does not have any particular internal structure, for example, plain text or image data.
  • Map Reduce works well on unstructured or semi structured data , since it designed to interpret  the data at processing time. In order words , the input keys and values for MapReduce are not an intrinsic property of the data, but they are chosen by the person analyzing the data.
  • Relational data is often normalized to retain its integrity & remove redundancy.
  • Map Reduce is linearly scalable programming model. Its task is to write Map Function & Reducr function by keeping Shuffle. Each of which defines a mapping from one set of key-value pairs to another. These function are oblivious to the size of the data or the cluster thay are operating on, so they can be used unchanged for small dataset and for massive one.


  • Apache Hadoop & Hadoop Ecosystem on Windows Azure Platform(Azure HDInsight):
  •  Common: A set of operations & interfaces for distributed filesystems & general I/O (Serialization, Java RPC, persistent data structures)
  • Avro : A serialization system for efficient , cross language persistent data storage.
  • MapReduce: A Distributed data processing model and execution environment thsat runs on large clusters of commodity machines.
  • HDFS: A distributed filesystem that runs on large clusters of commodity machines.
  • Pig: A data flow language and execution environment for exploring very large datasets. Pig runs on HDFS and MapReduce clusters.
  • Hive: A distributed data warehouse. Hive Manages data stored in HDFS & provides  batch style computations & ETL by HQL.
  • HBase: A distributed , column oriented database, HBase uses HDFS for its underlying storage, supported both batch – style computations using MapReduce and point queries.
  • ZooKeeper: A Distributed , highly available coordination service. ZooKeeper provides primitives such as distributed locks can be applied on distributed applications.
  • Sqoop: A Tool for efficiently moving data between RDBMS  & HDFS (from SQL Server/SQL Azue/Oracle to HDFS and vice-versa)

Lets check to create a Hadoop Cluster on Windows Azure HDInsight  on http://www.hadooponazure.com:

HadoopAzureCluster


HadoopCluster


  • Check out the Interactive Console on Hadoop on Azure EMR to execute Pig/Latin scripts or Hive data ware housing queries.

Console