Predictive Analytics of UK Electoral Decisions using PowerBI for Office 365
September 21, 2014 Leave a comment
There was significant breaking update over last few days regarding Scotland voting referendum 2014, while in social media magnificently came up millions of tweets, likes , shares & overall big sentiment & prediction details about Scotland’s next future declaration. In this demo, we would roll over quite a similar social ramp-up of predictive analysis of Voting results of UK over 2014 & 2009 using Microsoft PowerBI & Office 365.
First, throughout the demo, I used the powerbi components like PowerPivot, PowerQuery, PowerView & PowerMap along with PowerQ&A integrated with office 365. Lets start to consume the dataset from ‘online search‘ feature of PowerQuery. Searched here coined the term as ‘UK parliament elections prediction’ & selected the related OData feed URL.
Using PowerQuery editor, analyse & transform the data for processing & feeding into data-model.
Next, after building the data-model , featuring appropriate keys with datasets, first build -up the sample powerpivot dashboard.
To figure-out powerview reports , simply click on PowerView tab & start build Prediction analysis results of UK electoral decisions over 2014 & 2009.
The predictive analytics of UK electoral decisions on 2014 & 2009 has been depicted with respected with representations data & key value of data differentiation which displays analysis through stacked bar & data representations key over entire electoral regions.
Next, Click on ‘Map’ icon & select ‘Launch Power Map‘ to build up PowerMap of 3D visualization on predicted analysed result set over the regions of United Kingdom.
Create first a new ‘Tour’ & add layer to start move over 3D visualization with realistic dashboard views. For this demo, I used ‘electoral regions’ as ‘country‘ field to locate the geography on map.
I created a video presentation of the powermap 3D visualization tour of predictive analytics results of UK over 2014 & 2009.
Next, Check on PowerBI on office 365, you need to have either E3 /E4 subscription of Office 365 tenant or otherwise go for a trial account provisioning from here.
After provisioning PowerBI for Office 365, you need to add permissions for SharePoint users. Add ‘PowerBI for Office 365’ tenant under your subscription & move to ‘sites‘ category & click on ‘team site‘ app.
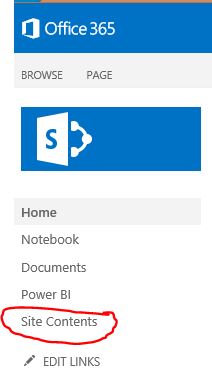
Next, inside ‘team site’ portal , you will be able to see the option ‘site content‘ , clicking on it jump to ‘PowerBI‘ section for the office 365 site.
Next, after entering into PowerBI tab , add/drag your excel 2013 workbook containing PowerView , PowerMap dashboards into Office 365 portal.
Now, add some natural language enhanced Power Q & A on your analytics dashboard , click on option ‘Add to PowerQ&A‘ & start frame up relative questions to build up real time analytics dashboard on office 365.
For example, in this demo, I utilized the sample queryset as ‘show representations on 2014 by representation in 2009‘ on powerQ&A query bar.
‘Show Representations by Electoral Regions on 2014’ used as a search term & portrayed the predicted result as like this.
Also, visualizing the PowerBI site on o365 is overwhelming in terms of real time analysis all over the dataset & collaborating with the team.
Lastly, to access the real time predictive analytics report on PowerBI is accessible through PowerBI app on Windows Store which leverages to share , collaborate your analytics results on any device & enables to view it anywhere , anytime .


You must be logged in to post a comment.