Azure Stream Analytics & Machine Learning Integration With RealTime Twitter Sentiment Analytics Dashboard on PowerBI


Recently, it has been introduced the integration of ASA & AML available as preview update & it’s possible to add AML web service URL & API key as ‘custom function‘ with ASA input. In this demo, realtime tweets are collected based on keywords like ‘#HappyHolidays2016‘, ‘#MerryChristmas‘, ‘#HappyNewYear2016‘ & those are directly stored on a .csv file saved on OneDrive. Here goes the solution architecture diagram of the POC.

SolutionArc


Now, add the Service Bus event hub endpoint as input to the ASA job, while deploy the ‘Twitter Predictive Sentiment Analytics Model‘  & click on ‘Open in Studio‘ to start deploy the model. Don’t forget to run the solution before deploying.

AML


Once the model is deployed, open the ‘Web Service‘ dashboard page to get the model URL & API key, click on default endpoint -> download the excel 2010 or earlier apps. Collect the URL & API key to apply it to ASA function credentials for AML deployment.

DeployedAML

Next, create an ASA job & add the event hub credentials where the real world tweets are getting pushed & click on ‘Functions‘ tab of ASA job to add the AML credentials. Provide model name, URL & API key of the model & Once, it’s added, click on Save.

ASA-Functions


Now, add the following ASA SQL to aggregate the realtime tweets sentiment scores coming out from predictive twitter sentiment model.

Query


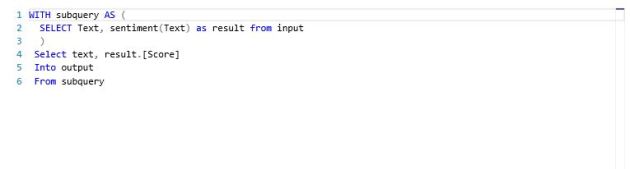
Provide the output as Azure Blob storage, add a container name & serialization type as CSV & start the ASA job. Also, start importing data into PowerBI desktop from the ASA output Azure blob storage account.

Output


PowerBI desktop contains in-built power Query to start preparing the ASA output data & processing data types. Choose the AML model sentiment score datatype as decimal type & TweetTexts as Text(String) type.

PBI-AML


Start building the ‘Twitter Sentiment Analytics‘ dashboard powered by @AzureStreaming & Azure Machine Learning API with realworld tweet streaming, there’re some cool custom visuals are available on PowerBI.  I’ve used some visuals here like ‘wordcloud‘ chart which depicts some of the highly scored positive sentiment contained tweets with most specific keywords like ‘happynewyear2016‘, ‘MerryChristmas‘,’HappyHolidays‘ etc.

PBI-visuals


While, in the donut chart, the top 10 tweets with most positive sentiment counts are portrayed with the specific sentiment scores coming from AML predictive model experiment integrated with ASA jobs.

PBI-dashboard

~Wish you HappyHolidays 2016!

Predictive Analytics of UK Electoral Decisions using PowerBI for Office 365


There was significant breaking update over last few days regarding Scotland voting referendum 2014, while in social media magnificently came up millions of tweets, likes , shares & overall big sentiment & prediction details about Scotland’s next future declaration.  In this demo, we would roll over quite a similar social ramp-up of predictive analysis of Voting results of UK over 2014 & 2009 using Microsoft PowerBI & Office 365.

First, throughout the demo, I used the powerbi components like PowerPivot, PowerQuery, PowerView & PowerMap along with PowerQ&A integrated with office 365. Lets start to consume the dataset from ‘online search‘ feature of PowerQuery. Searched here coined the term as ‘UK parliament elections prediction’ & selected the related OData feed URL.

online

Using PowerQuery editor, analyse & transform the data for processing & feeding into data-model.

Voting Data

Next, after building the data-model , featuring appropriate keys with datasets, first build -up the sample powerpivot dashboard.

Voting

To figure-out powerview reports , simply click on PowerView tab & start build Prediction analysis results of UK electoral decisions over 2014 & 2009.

PowerView


The predictive analytics of UK electoral decisions on 2014 & 2009 has been depicted with respected with representations data & key value of data differentiation which displays analysis through stacked bar & data representations key over entire electoral regions.

Next, Click on ‘Map’ icon & select ‘Launch Power Map‘ to build up PowerMap of 3D visualization on predicted analysed result set over the regions of United Kingdom.


icons

Create first a new ‘Tour’ & add layer to start move over 3D visualization with realistic dashboard views. For this demo, I used ‘electoral regions’ as ‘country‘ field to locate the geography on map.

PowerMap

I created a video presentation of the powermap 3D visualization tour of predictive analytics results of UK over 2014 & 2009.

Next, Check on PowerBI on office 365, you need to have either E3 /E4 subscription of Office 365 tenant or otherwise go for a trial account provisioning from here.

After provisioning PowerBI for Office 365, you need to add permissions for SharePoint users. Add ‘PowerBI for Office 365’ tenant under your subscription & move to ‘sites‘ category & click on ‘team site‘ app.

Next, inside ‘team site’ portal , you will be able to see the option ‘site content‘ , clicking on it jump to ‘PowerBI‘ section for the office 365 site.


site


PowerBI

Next, after entering into PowerBI tab , add/drag your excel 2013 workbook containing PowerView , PowerMap dashboards into Office 365 portal.

O365

Now, add some natural language enhanced Power Q & A on your analytics dashboard , click on option ‘Add to PowerQ&A‘ & start frame up relative questions to build up real time analytics dashboard on office 365.

For example, in this demo, I utilized the sample queryset as ‘show representations on 2014 by representation in 2009‘ on powerQ&A query bar.

PowerQ&A

‘Show Representations by Electoral Regions on 2014’ used as a search term & portrayed the predicted result as like this.


KeyQ&A

Also, visualizing the PowerBI site on o365 is overwhelming in terms of real time analysis all over the dataset & collaborating with the team.

Dashboardo365


Lastly, to access the real time predictive analytics report on PowerBI is accessible through PowerBI app on Windows Store which leverages to share , collaborate your analytics results on any device & enables to view it anywhere , anytime .

WinPowerBI

An OverView of HDInsight (Hadoop+HBase) with Integrated PowerShell along with R


Recently, while started the work with Predictive Analytic s with Machine Learning & R , felt the necessity of integration of Azure HDInsight-HBase with Azure ML features. In this demo, we ‘ll go through few basic understandings of operations on HDInsight(Hadoop) on Azure with PowerShell 0.8.6.

To start with, first we need to create an azure storage account which must be in same datacenter (e.g SouthEast Asia for this demo) of HDInsight cluster.


StorageAccount

You need also create a blob container & storage context object in order to copy raw data (e.g Click Stream data, log data, machine-sensor data) to local drive to azure storage account.


StorageAcc


To Copy data from local drive to Azure Storage container , use the following script.

CopyDataToBlob


Next, we need to provision the HDInsight cluster , for that need to execute the following script.

ProvisioningCluster

Upon, executing the script, the cluster provisioning is started from accept, configuring , provisioning phase. You need to assign the username & password manually.

HDInsightProvision

ClusterProvisioned


Next, check in Azure management portal after few mins, the provisioning have been started.

Portal

Details of HDInsight cluster provisioning along with running HQL queries is stored in my github repository. You can get it here.

Now, HBase columnar storage is available as a part of hadoop cluster from HDInsight offerings, so while provisioning cluster from portal , you need the corresponding cluster type – HBase or Hadoop.

HBase

Both of cluster type(either HBase or Hadoop) of HDInsight 3.1 is completely based of pure Hortonworks HDP 2.1 clusters which contains the hadoop components of the following version.

  • Apache Hadoop 2.4
  • Apache HBase 0.98.0
  • Apache Pig 0.12.1
  • Apache Hive 0.13.0
  • Apache Tez 0.4
  • Apache ZooKeeper 3.4.5
  • Hue 2.3.1
  • Storm 0.9.1
  • Apache Oozie 4.0.0
  • Apache Falcon 0.5
  • Apache Sqoop 1.4.4
  • Apache Knox 0.4
  • Apache Flume 1.4.0
  • Apache Accumulo 1.5.1
  • Apache Phoenix 4.0.0
  • Apache Avro 1.7.4
  • Apache Mahout 0.9.0
  • Third party components:
    • Ganglia 3.5.0
    • Ganglia Web 3.5.7
    • Nagios 3.5.0


    For Big Data analytics world , one of the most fine-grained language that supports now with Azure ML is R. You can install R official packages for Windows, Linux & OS X, also for official project perspective , use R IDE.

    R Packages:

    R packages are self-contained units of R functionality that can be invoked as functions. A good analogy would be a .jar file in Java. There is a vast library of
    R packages available for a very wide range of operations ranging from statistical operations and machine learning to rich graphic visualization and plotting. Every package will consist of one or more R functions. An R package is a re-usable entity that can be shared and used by others. R users can install the package that contains the functionality they are looking for and start calling the functions in the package. A comprehensive list of these packages can be found at http://cran.r-project.org/ called Comprehensive R Archive Network (CRAN).

    Data Modelling with R:

    Regression: In statistics, regression is a classic technique to identify the scalar relationship between two or more variables by fitting the state line on the
    variable values. That relationship will help to predict the variable value for future events. For example, any variable y can be modeled as linear function
    of another variable x with the formula y = mx+c. Here, x is the predictor variable, y is the response variable, m is slope of the line, and c is the
    intercept. Sales forecasting of products or services and predicting the price of stocks can be achieved through this regression. R provides this regression
    feature via the lm method, which is by default present in R.
    Classification: This is a machine-learning technique used for labeling the set of observations provided for training examples. With this, we can classify
    the observations into one or more labels. The likelihood of sales, online fraud detection, and cancer classification (for medical science) are common
    applications of classification problems. Google Mail uses this technique to classify e-mails as spam or not. Classification features can be served by glm,
    glmnet, ksvm, svm, and randomForest in R.
    Clustering: This technique is all about organizing similar items into groups from the given collection of items. User segmentation and image
    compression are the most common applications of clustering. Market segmentation, social network analysis, organizing the computer clustering,
    and astronomical data analysis are applications of clustering. Google News uses these techniques to group similar news items into the same category.
    Clustering can be achieved through the knn, kmeans, dist, pvclust, and Mclust methods in R.

    Recommendation: The recommendation algorithms are used in recommender systems where these systems are the most immediately recognizable machine learning techniques in use today. Web content recommendations may include similar websites, blogs, videos, or related content. Also, recommendation of online items can be helpful for cross-selling and up-selling. We have all seen online shopping portals that attempt to recommend books, mobiles, or any items that can be sold on the Web based on the user’s past behavior. Amazon is a well-known e-commerce portal that generates 29 percent of sales through recommendation systems. Recommender systems can be implemented via Recommender()with the recommenderlab package in R.