Last month on #AzureConf 2015, the Azure IoT Suite has been announced to be available for purchase along with the GA release of Azure IoT Hub. The IoT Hub helps to control, monitor & connect thousands of devices to communicate via cloud & talk to each other using suitable protocols. You can connect to your Azure IoT Hub using the IoT Hub SDKs available in different languages like C, C#, Java, Ruby etc. Also, there’re monitoring devices available like device explorer or iothub-explorer. In this demo, Weather Data Analytics is demonstrated using Azure IoT Hub with Stream Analytics powered by Azure IoT Suite & visualized using Azure SQL database with PowerBI.
You can provision your own device into Azure IoT analytics Suite using device explorer or iothub-explorer tool & start bi-directional communication through device-cloud & cloud-device.
First, create your Azure IoT Hub from Azure Preview Portal by selecting New-> Internet of Things -> Azure IoT Hub. Provide hub name, select pricing & scale tier[F1 – free(1/subscription, connect 10 devices, 3000 messages /day), [S1 – standard (50,000 messages/day) & S2- standard(1.5 M messages/day)] for device to cloud communication. Select IoT Hub units, device to cloud partitions, resource group, subscription & finally location of deployment(currently it’s available only in three locations- ‘East Asia’, ‘East US’, ‘North Europe’.

Once the hub is created, next switch to device explorer to start creating a device, for details about to create a device & register, refer to this Github page. After registering the device, move back to ‘Data‘ tab of device explorer tool & click on ‘Monitor‘ button to start receive device-cloud events sent to Azure IoT Hub from device.

The schema for the weather dataset looks like the following data & fresh data collected from various sensors & feed into Azure IoT Hub which can be viewed using Device Explorer tool.

In order to push data from weather data sensor device to Azure IoT hub, the following code snippet needs to be used. The full code-snipped is going to be available on my Github page.
using System;
using System.Text;
using System.Threading.Tasks;
using System.IO;
using System.Data;
using Newtonsoft.Json;
using Microsoft.VisualBasic;
using Microsoft.VisualBasic.FileIO;
namespace Microsoft.Azure.Devices.Client.Samples
{
class Program
{
private const string DeviceConnectionString = “Your device connection-string”;
private static int MESSAGE_COUNT = 5;
static string data = string.Empty;
static void Main(string[] args)
{
try
{
DeviceClient deviceClient = DeviceClient.CreateFromConnectionString(DeviceConnectionString);
if (deviceClient == null)
{
Console.WriteLine(“Failed to create DeviceClient!”);
}
else
{
SendEvent(deviceClient).Wait();
ReceiveCommands(deviceClient).Wait();
}
Console.WriteLine(“Exited!\n”);
}
catch (Exception ex)
{
Console.WriteLine(“Error in sample: {0}”, ex.Message);
}
}
static async Task SendEvent(DeviceClient deviceClient)
{
string[] filePath = Directory.GetFiles(@”\Weblog\”,”*.csv”);
string csv_file_path = string.Empty;
int size = filePath.Length;
for(int i=0; i< size; i++)
{
Console.WriteLine(filePath[i]);
csv_file_path = filePath[i];
}
DataTable csvData = GetDataTableFromCSVFile(csv_file_path);
Console.WriteLine(“Rows count:” + csvData.Rows.Count);
DataTable table = csvData;
foreach(DataRow row in table.Rows)
{
foreach(var item in row.ItemArray)
data = item.ToString();
Console.Write(data);
try
{
foreach(DataRow rows in table.Rows)
{
var info = new WeatherData
{
weatherDate = rows.ItemArray[0].ToString(),
weatherTime = rows.ItemArray[1].ToString(),
apperantTemperature = rows.ItemArray[2].ToString(),
cloudCover = rows.ItemArray[3].ToString(),
dewPoint = rows.ItemArray[4].ToString(),
humidity = rows.ItemArray[5].ToString(),
icon = rows.ItemArray[6].ToString(),
pressure = rows.ItemArray[7].ToString(),
temperature = rows.ItemArray[8].ToString(),
timeInterval = rows.ItemArray[9].ToString(),
visibility = rows.ItemArray[10].ToString(),
windBearing = rows.ItemArray[11].ToString(),
windSpeed = rows.ItemArray[12].ToString(),
latitude = rows.ItemArray[13].ToString(),
longitude = rows.ItemArray[14].ToString()
};
var serializedString = JsonConvert.SerializeObject(info);
var message = data;
Console.WriteLine(“{0}> Sending events: {1}”, DateTime.Now.ToString(), serializedString.ToString());
await deviceClient.SendEventAsync(new Message(Encoding.UTF8.GetBytes(serializedString.ToString())));
}
}
catch(Exception ex)
{
Console.ForegroundColor = ConsoleColor.Red;
Console.WriteLine(“{0} > Exception: {1}”, DateTime.Now.ToString(), ex.Message);
Console.ResetColor();
}
// Task.Delay(200);
}
Console.WriteLine(“Press Ctrl-C to stop the sender process”);
Console.WriteLine(“Press Enter to start now”);
Console.ReadLine();
//string dataBuffer;
//Console.WriteLine(“Device sending {0} messages to IoTHub…\n”, MESSAGE_COUNT);
//for (int count = 0; count < MESSAGE_COUNT; count++)
//{
// dataBuffer = Guid.NewGuid().ToString();
// Message eventMessage = new Message(Encoding.UTF8.GetBytes(dataBuffer));
// Console.WriteLine(“\t{0}> Sending message: {1}, Data: [{2}]”, DateTime.Now.ToLocalTime(), count, dataBuffer);
// await deviceClient.SendEventAsync(eventMessage);
//}
}
private static DataTable GetDataTableFromCSVFile(string csv_file_path)
{
DataTable csvData = new DataTable();
string data = string.Empty;
try
{
using (TextFieldParser csvReader = new TextFieldParser(csv_file_path))
{
csvReader.SetDelimiters(new string[] { “,” });
csvReader.HasFieldsEnclosedInQuotes = true;
//read column names
string[] colFields = csvReader.ReadFields();
foreach (string column in colFields)
{
DataColumn datecolumn = new DataColumn(column);
datecolumn.AllowDBNull = true;
csvData.Columns.Add(datecolumn);
}
while (!csvReader.EndOfData)
{
string[] fieldData = csvReader.ReadFields();
for (int i = 0; i < fieldData.Length; i++)
{
if (fieldData[i] == “”)
{
fieldData[i] = null;
}
}
csvData.Rows.Add(fieldData);
}
}
}
catch (Exception ex)
{
Console.WriteLine(“Exception” + ex.Message);
}
return csvData;
}
static async Task ReceiveCommands(DeviceClient deviceClient)
{
Console.WriteLine(“\nDevice waiting for commands from IoTHub…\n”);
Message receivedMessage;
string messageData;
while (true)
{
receivedMessage = await deviceClient.ReceiveAsync(TimeSpan.FromSeconds(1));
if (receivedMessage != null)
{
messageData = Encoding.ASCII.GetString(receivedMessage.GetBytes());
Console.WriteLine(“\t{0}> Received message: {1}”, DateTime.Now.ToLocalTime(), messageData);
await deviceClient.CompleteAsync(receivedMessage);
}
}
}
}
}
You could check output to events sending from device to cloud on console.

Next, start pushing the device data into Azure IoT Hub & monitor the events receiving process through device explorer. Now, start provisioning an Azure Stream Analytics Job on Azure portal. Provide ‘Azure IoT Hub‘ as an input to the job like as the followings.


Now provide Azure Stream Analytics Query to connect incoming unstructured datasets from device to cloud to pass into Azure SQL database. So, first, provision a SQL database on Azure & connect to as output to Stream Analytics job.
create table input(
weatherDate nvarchar(max),
weatherTime datetime,
apperantTemperature nvarchar(max),
cloudCover nvarchar(max),
dewPoint nvarchar(max),
humidity nvarchar(max),
icon nvarchar(max),
pressure nvarchar(max),
temperature nvarchar(max),
timeInterval nvarchar(max),
visibility nvarchar(max),
windBearing nvarchar(max),
windSpeed nvarchar(max),
latitude nvarchar(max),
longitude nvarchar(max)
)
select input.weatherDate, input.weatherTime,input.apperantTemperature,input.cloudCover,
input.dewPoint, input.humidity,input.icon,input.pressure,count(input.temperature) as avgtemperature, input.timeInterval, input.visibility, input.windBearing,
input.windSpeed,input.latitude,input.longitude
into weathersql
from input
group by input.weatherDate, input.weatherTime, input.apperantTemperature,input.cloudCover,
input.dewPoint, input.humidity,input.icon, input.pressure,input.timeInterval,input.visibility, input.windBearing,
input.windSpeed,input.latitude,input.longitude, TumblingWindow(second,2)

Specify the output of ‘WeatherIoT’ ASA job as ‘Azure SQL Database‘, alternatively, you can select any of the rest of the connectors like ‘Event Hub’, ‘DocumentDB’ etc.

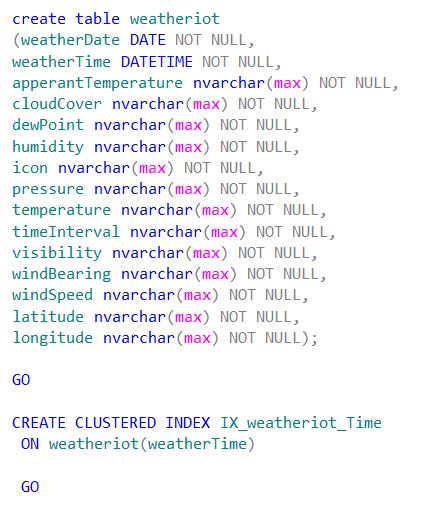
Make sure that , to create the necessary database & table first on SQL before adding as output to ASA job. For this demo, I have created the ‘weatheriot‘ table on Azure SQL database. The t-sql query looks like this.

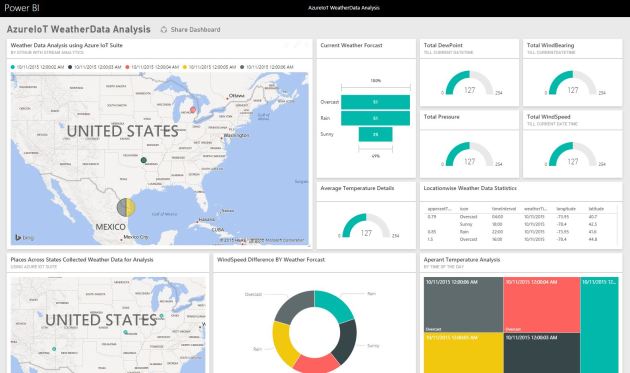
Next, start the ASA job & receive the final Azure IoT hub(device to cloud) data processed to IoT hub ->ASA -> Azure SQL database pipeline. Once you receive data on your Azure SQL table. Start building the PowerBI ‘Weather IoT Data Analytics’ dashboard for visualization & to leverage the power of Azure IoT momentum.

Connect to PowerBI connected through same account of Azure subscription where you provisioned the ASA job & start importing data from Azure SQL database. Create stunning reports using funnel, donut, global map charts with live data refresh.

For this demo, I’ve populated charts on average weather temperature, pressure, humidity, dew point forecasting analysis over specific areas based on latitude & longitude values, plotted & pinned into PowerBI ‘Weather Data Azure IoT Analytics’ dashboard.


You must be logged in to post a comment.