Big Data Analytics- PowerBI (PowerQuery & PowerMap) dashboards using HDInsight,Facebook data using Office 365


In order to work on Big Data Analytics (ClickStream,Sentiment,RealTime) , its very important to work with PowerBI (PowerQuery & PowerMap) using Office 365. Microsoft Power Query Preview is an Excel add-in that enhances the self-service Business Intelligence experience in Excel by simplifying data discovery and access. Power Query enables users to easily discover, combine, and refine data for better analysis in Excel.

Power Map Preview for Excel 2013 allows you to plot geographic and temporal data visually, analyze that data in 3D, and create interactive tours to share with others.

  • Download PowerQuery addin for Excel 2013 from here & PowerMap addins for Excel 2013 from here.

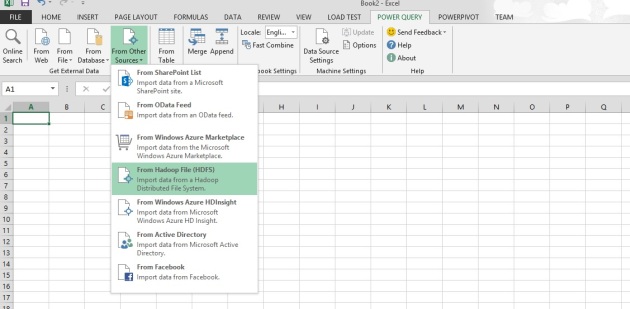
Let me show you a brief overview about Power Query after installing the addins for excel. open the PowerQuery tab & check the data importing options.

PowerQuery

  • Under Data sources option on PowerQuery , you will find options to import data from HDFS, Azure HDInsight , even from Facebook too.
  • For this demo, I have selected , HDFS (Hadoop distributed File System) & Azure HDInsight option.
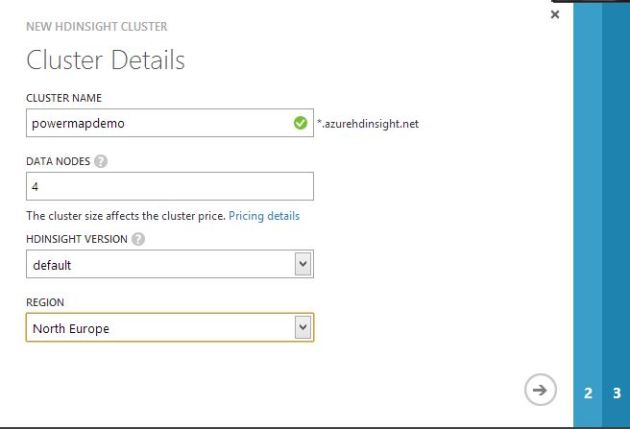
  • Lets first create a HDInsight cluster in portal.

Cluster

Next , provide final configuration values(Azure Storage Account Vaults [ASV] details) in order to create the cluster.

AddConfig

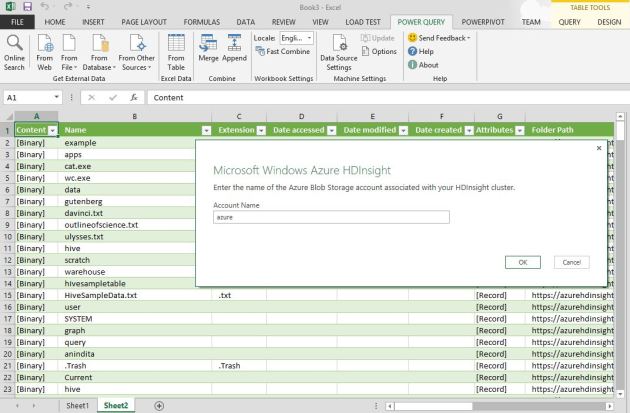
  • Lets integrate the HDInsight cluster data with PowerQuery of Excel. Choose ‘Data Sources‘ as ‘Azure HDInsight Cluster‘.

HDInsight

  • On Query Editor, specify the hdfs table data by selecting appropriate query & click on ‘done‘.

QueryEditor

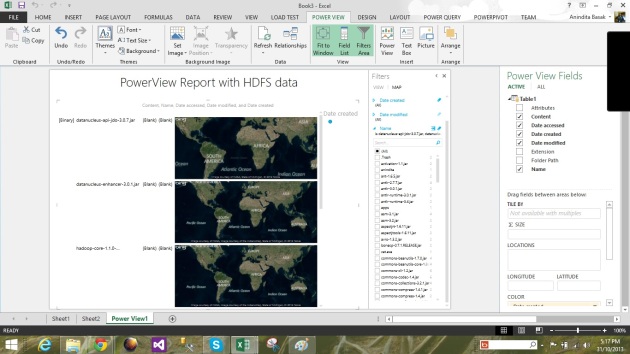
  • Next, click on PowerView in order to create an interactive dashboard with PowerView using PowerQuery from HDFS data of Azure Storage Vault(ASV).

PowerView

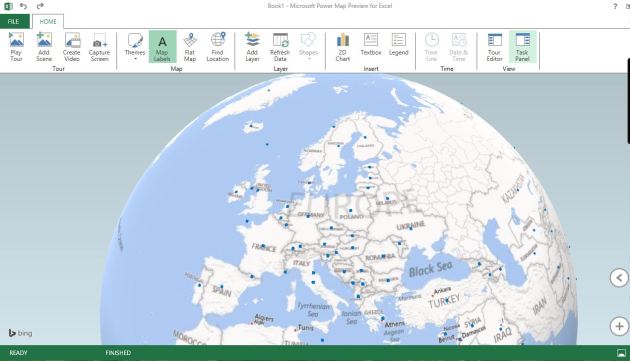
  • To work with PowerMap for Office 365: after installing the powermap addin , lets choose the ‘Map‘ option from ‘insert’ tab of excel 2013.

PowerMap

  • Created a sample report using World Bank’s data on Income Basis from Windows Azure Marketplace which has been imported  into hdfs.

Map

    • Created a video tour of the PowerMap dashboard using World Bank’s statistical data of countries by income level. Access it here.
 

how to execute Cloudera Hadoop(CDH4) Quickstart VM(CentOS 6.2) in Windows with VMware workstation


In order to execute Cloudera Hadoop CDH4 VM in Windows , you need to download the quickstart VM from here according to your VM version(i.e VMware/VirtualBox/KVM). It requires a 64 bit host OS. This VM runs CentOS 6.2 and includes CDH4.3, Cloudera Manager 4.6, Cloudera Impala 1.0.1 and Cloudera Search .9 Beta.

For this demo, I have used VMware version of Cloudera Quickstart VM for running on Windows 8 64 bit host OS.

Few points to ponder:

  • This is a 64-bit VM, and requires a 64-bit host OS and a virtualization product that can support a
    64-bit guest OS.
  • This VM uses 4 GB of total RAM. The total system memory required varies depending on the size
    of your data set and on the other processes that are running.
  • The demo VM file is approximately 2 GB. Feel free to mirror internally or externally to minimize
    bandwidth usage.
  • To use the VMware VM, you must use a player compatible with WorkStation 8.x or higher: Player 4.x or higher, ESXi 5.x or higher, or Fusion 4.x or higher. Older versions of WorkStation can be used to create a new VM using the same virtual disk (VMDK file), but some features in VMware Tools won’t be available.
  • After downloading the Cloudera VM , extract it & select the virtual machine configuration (.vmx) file.

vmware

  • Open the .vmx file by vmware workstation & start the VM.

cloudera boot


cloudera-quickstart-demo-vm-2013-08-10-21-10-52


  • To start work on hadoop console, click on hue & login with default Id ‘admin’ & password ‘admin’

cloudera-quickstart-demo-vm-2013-08-10-21-12-44


cloudera-quickstart-demo-vm-2013-08-10-21-15-36


  • Similarly, login to cloudera manager console with default user id ‘admin‘ & password ‘admin‘ in order to check hadoop cluster’s health.

cloudera-quickstart-demo-vm-2013-08-10-21-18-07


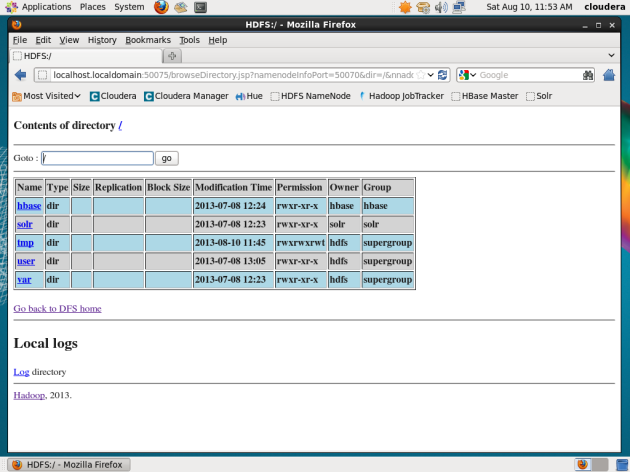
  • You can check the hadoop namenode cluster details with summary along with namenode logs along with HDFS clusters.

cloudera-quickstart-demo-vm-2013-08-10-21-20-47


cloudera-quickstart-demo-vm-2013-08-10-21-23-15


  • Cloudera Hadoop (CDH4) VM contains inbuilt eclipse integrated with apache hadoop to write mapreduce jobs with ease.

cloudera-quickstart-demo-vm-2013-08-10-21-25-00


  • Once you open the eclipse integrated with hadoop, a default MapReduce java project is available which runs on Java SE 1.6

cloudera-quickstart-demo-vm-2013-08-10-21-28-26

A lap around of Big Data with Microsoft HDInsight


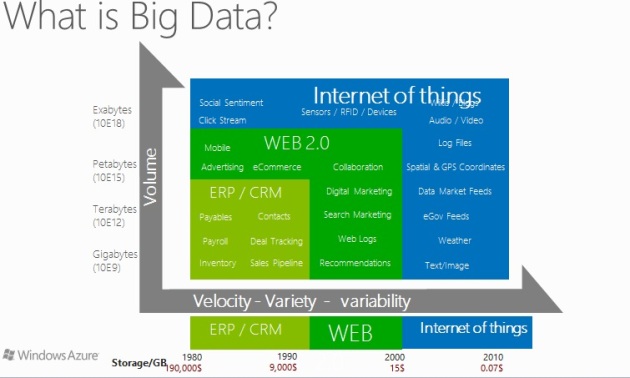
Big Data synonyms with three V s :  Volume , Velocity & Variety. Even with traditional e-commerce system to modern social networks  all systems data conservation is dependent on this platform. Lets check a scenario of modern e-commerce analytic s after integration with Big Data.

bigdata

ecommerce

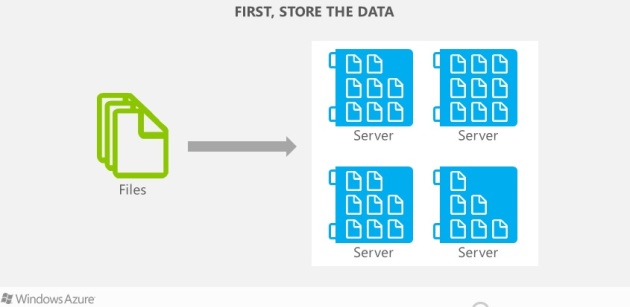
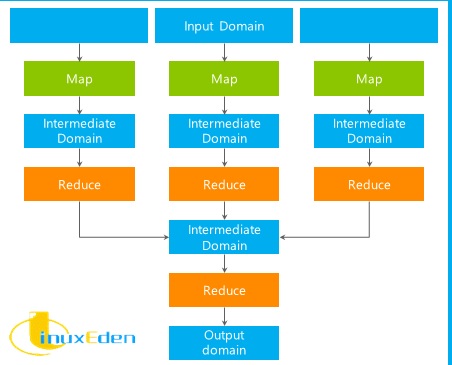
  • Big Data platform typically works by storing data first into clusters , then process the data through MapReduce workflows which executes by Mapping the input data through independent chunks processed by appropriate algorithms, the output from Map phase then moves to Shuffle/Sorting phase & finally the output from Shuffle phase comes to Reduce phase as input.
  • Lets check a typical Big Data MapReduce workflow.

storedata

processdata

MR

  • Microsoft’s BigData platform works exactly same way as a collaborative solution with Horton Works named as Microsoft HDInsight. Which typically simplifies the solution of running complex batch scripts. Lets cover a little insight of HDInsight/Hadoop ecosystem.

HDinsight

  • Microsoft’s Big Data platform unveils solutions from storing data into HDFS to query processing on Hive up to implementing Business Intelligence analytics on Excel Powerpivot, Powerpivot, SSAS & SSRS solutions.

MSBigdata

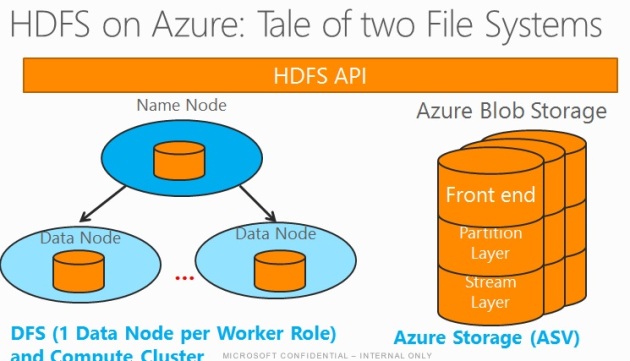
  • Storing data into HDFS : Petabytes to Zetabytes of data to be stored in HDFS clusters by means of Name Node followed by Data Nodes, in Azure HDInsight each Data Node is integrated with a worker roles & compute cluster. Alternatively , you can leverage the solutions using Azure Blob Storage utilizing  Front End(attaches OAuth/Security layer for authentication), Partition layer: for mapping with Azure Queue, table & blob storages , Stream layer : 3 layer HA for scaled out data stream.

HDFS

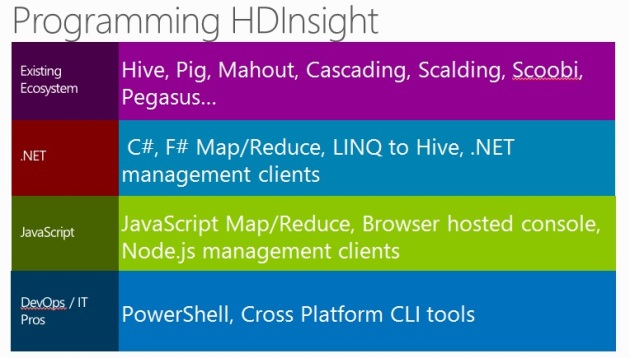
  • In order to programming on HDInsight , you can opt for Java, C#, F#, .NET, .js API, LINQ to Hive APIs which leverages to code on hadoop ecosystems including hadoop pig, hive, mahout, cascading, pegasus.

hdinsight_API

Microsoft's Hadoop Vision

Microsoft’s Hadoop Vision

Microsoft Twitter Analytics Tools(Consuming Big Data from Hadoop on Azure) with PowerPivot for Excel 2010 & Build PowerView Reports on SharePoint 2010 & SQL Server 2012 Analysis Services


Microsoft Twitter Analytics tool (Download from here) is part of SQL Azure Social Analytics Labs & leverages built in support for consuming Big Data (Hadoop on Azure, Hive Tables data, HDFS ) on BI tools(PowerPivot for Excel 2010, SSRS 2012 , SSAS 2012 & PowerView Reports on SharePoint 2010). Twitter Analytics is computed data for analysis of Social Analytics tool (Twitter, LinkedIn, Facebook) to compute Top Tweets of the Day, Top Tweeter, Top Mentions etc. Overall computation focuses on Big Data Analytics on Windows Azure features commonly consume big data from Apache Hive, HDFS on Azure to MS BI tools.

  • Lets start first installing the tool on local system. It needs PowerPivot for Excel 2010 as recommendation engine to analyse the analytics sheet.

  • The Twitter Analytics installer installs the Twitter Analytics PowerPivot Excel 2010 sheet on your desktop. Analyse the Twitter Analytics PowerPivot sheet by providing the comma seperated queries to get data for Top Tweets for Top MSFT Products(Bing, Windows Phone, SQL Server etc.)

  • Lets check for Top People section of the Twitter Analytics tool for Favourite MSFT Products.

  • The Top Tweet Tones & Mentions about Top MSFT Products renders as follows.

  • The Details data shows off the Twitter Data Analytics according to Search Query,Date, Time of Day,Type, Tone & Tweeters.

  • Next, upload the Twitter Analytics PowerPivot Excel sheet into SharePoint 2010 PowerPivot Gallery part in order to build interactive PowerView Reports on SharePoint .

  • After uploading to SharePoint PowerView Gallery, Click on PowerView Report icon to build up the PowerView Report.


  • Implement the PowerView Report on MSFT Twitter Analytics Social Analytics Big Data with SharePoint 2010 web part & select Top Tweets of the day, Top Mentions of the Day about top MSFT Products, Tones count & People Positive , Negetive & Neutral Tones on Products like Bing, Office, SQL Server, Windows Phone.