Predictive Analytics of UK Electoral Decisions using PowerBI for Office 365


There was significant breaking update over last few days regarding Scotland voting referendum 2014, while in social media magnificently came up millions of tweets, likes , shares & overall big sentiment & prediction details about Scotland’s next future declaration.  In this demo, we would roll over quite a similar social ramp-up of predictive analysis of Voting results of UK over 2014 & 2009 using Microsoft PowerBI & Office 365.

First, throughout the demo, I used the powerbi components like PowerPivot, PowerQuery, PowerView & PowerMap along with PowerQ&A integrated with office 365. Lets start to consume the dataset from ‘online search‘ feature of PowerQuery. Searched here coined the term as ‘UK parliament elections prediction’ & selected the related OData feed URL.

online

Using PowerQuery editor, analyse & transform the data for processing & feeding into data-model.

Voting Data

Next, after building the data-model , featuring appropriate keys with datasets, first build -up the sample powerpivot dashboard.

Voting

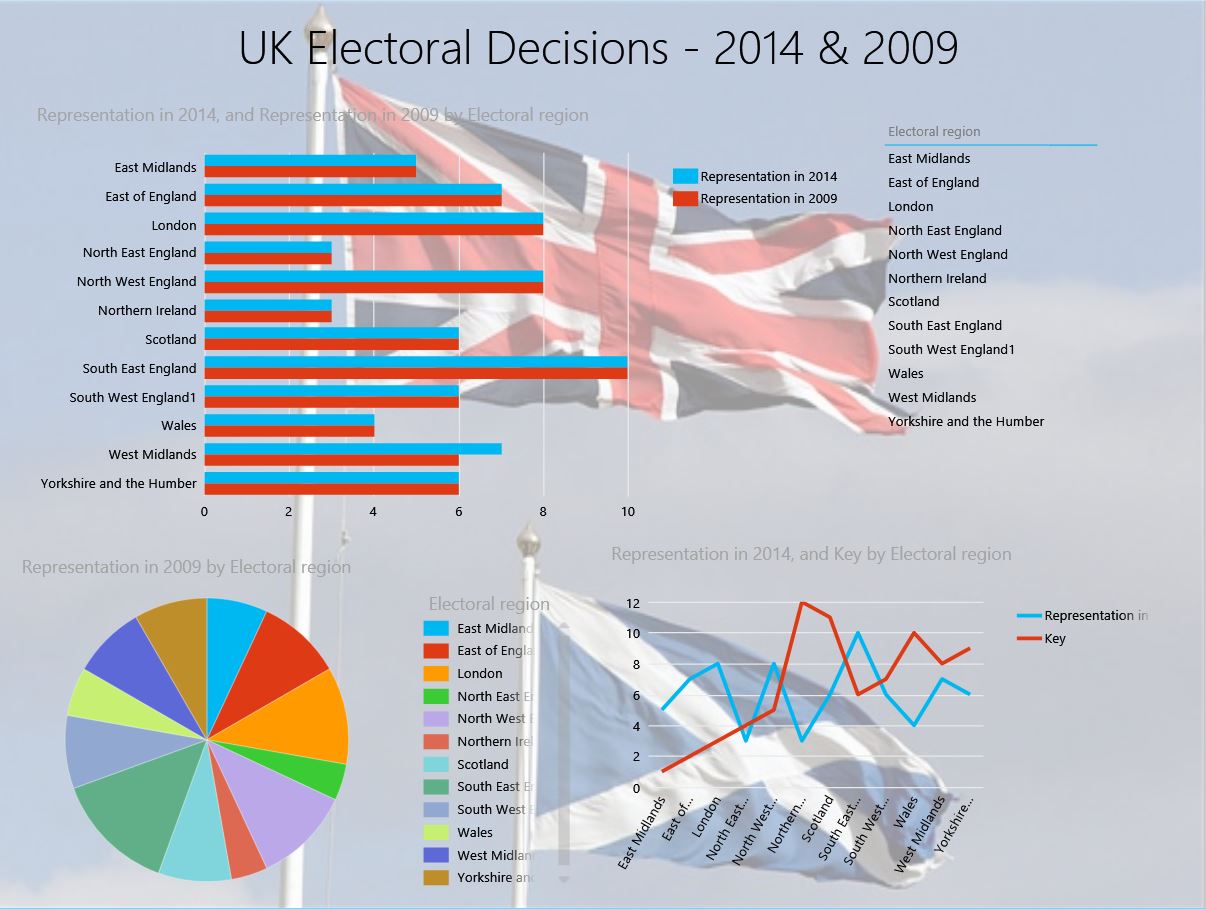
To figure-out powerview reports , simply click on PowerView tab & start build Prediction analysis results of UK electoral decisions over 2014 & 2009.

PowerView


The predictive analytics of UK electoral decisions on 2014 & 2009 has been depicted with respected with representations data & key value of data differentiation which displays analysis through stacked bar & data representations key over entire electoral regions.

Next, Click on ‘Map’ icon & select ‘Launch Power Map‘ to build up PowerMap of 3D visualization on predicted analysed result set over the regions of United Kingdom.


icons

Create first a new ‘Tour’ & add layer to start move over 3D visualization with realistic dashboard views. For this demo, I used ‘electoral regions’ as ‘country‘ field to locate the geography on map.

PowerMap

I created a video presentation of the powermap 3D visualization tour of predictive analytics results of UK over 2014 & 2009.

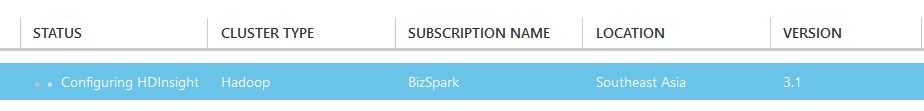
Next, Check on PowerBI on office 365, you need to have either E3 /E4 subscription of Office 365 tenant or otherwise go for a trial account provisioning from here.

After provisioning PowerBI for Office 365, you need to add permissions for SharePoint users. Add ‘PowerBI for Office 365’ tenant under your subscription & move to ‘sites‘ category & click on ‘team site‘ app.

Next, inside ‘team site’ portal , you will be able to see the option ‘site content‘ , clicking on it jump to ‘PowerBI‘ section for the office 365 site.


site


PowerBI

Next, after entering into PowerBI tab , add/drag your excel 2013 workbook containing PowerView , PowerMap dashboards into Office 365 portal.

O365

Now, add some natural language enhanced Power Q & A on your analytics dashboard , click on option ‘Add to PowerQ&A‘ & start frame up relative questions to build up real time analytics dashboard on office 365.

For example, in this demo, I utilized the sample queryset as ‘show representations on 2014 by representation in 2009‘ on powerQ&A query bar.

PowerQ&A

‘Show Representations by Electoral Regions on 2014’ used as a search term & portrayed the predicted result as like this.


KeyQ&A

Also, visualizing the PowerBI site on o365 is overwhelming in terms of real time analysis all over the dataset & collaborating with the team.

Dashboardo365


Lastly, to access the real time predictive analytics report on PowerBI is accessible through PowerBI app on Windows Store which leverages to share , collaborate your analytics results on any device & enables to view it anywhere , anytime .

WinPowerBI

An Overview of Latest Components of Azure HDInsight – Apache Tez, Yarn (MapReduce 2.0) Apache Storm & Kafka with HDP 2.1


Azure HDInsight 3.1 built on Hortonworks HDP 2.1 consists of lots of important components of hadoop 2.x like highly data-streaming component ‘Apache Tez’, the next generation(ngen) mapreduce 2.0 or ‘YARN’ node on top of HDFS along with realtime data streaming engine ‘Apache Storm’ & distributed message processing framework ‘Apache Kafka’. In this demo, we’ll check a little configuration info on each components running on Azure HDI cluster(3.1).

First, provision a HBase type HDI cluster through Azure PowerShell .

HBase

Next, you can check the provisioned Hbase HDI cluster on Azure Portal & enable RDP on it.

RDP

Next, On HDI cluster, first check the hadoop-components by browsing the directory ‘C:\apps\dist‘ where , you should see all components of HDP2.1 is prepared except Apache Storm.

Tez

Now, Tez -0.4.0.2.1.5.0-2057 is configured itself with HDI 3.1 Hbase cluster so, can check the hadoop-config page to run hive queries with Tez. For that, on cluster desktop, check the Yarn config page which clarifies the Yarn node status.

tez-hive

Now, Similarly, check the tez-site.xml , for configuration level & DAG node status purpose.

tez-site

Next, jump back to previous directory ‘C:\apps\‘ & write in search-pane on windows explorer ‘Storm‘. Copy the ‘storm-0.9.1.2.1.5.0-2057.zip‘ & paste it into ‘C:\apps\dist\‘ & then unzip it. Under .\bin directory find the Storm.cmd file which is needed for running Storm-Zookeeper, Storm-Nimbus, Storm-Supervisor & UI daemons.

First, configure the Storm.yaml with IPV4 address of HDI cluster then start executing first Storm-zookeeper nodes, master & slave daemon.

zookeeper

nimbus

Start the Supervisor (Worker) daemon job.

supervisor

And, at last start the UI job.

storm

Storm-UI can be viewed via web interface through browser on port 8080.

Storm UI

Next, to configure Apache Kafka for distributed message processing, we need to first download the stable version of kafka, I used here Kafka-0.8. You can download it from github repository as .zip https://github.com/apache/kafka

Now, after unzipping it , paste to same directory ‘C:\apps\dist\‘ with other components & start installation of Apache Kafka 0.8 on Azure HDI.

Before to do it, replace the windows .bat files under ‘C:\apps\dist\kafka-0.8\bin\windows\‘ with the latest kafka batch files for windows which can be downloaded from here.

Set the Java ClassPath on Hadoop command line or PowerShell as ‘Set Path=C:\apps\dist\java\bin

Next, update the scala & packages through the following commands.

.\sbt.bat update

kafka-sbt& then the list of commands :

.\sbt.bat package
.\sbt.bat assembly-package-dependency

After that, start the Zookeeper-server before starting Kafka-server.

.\bin\windows\zookeeper-server-start.bat .\config\zookeeper.properties

kafka-zookeeper-start

Now, Start the Kafka server by running the following command.

.\bin\windows\kafka-server-start.bat .\config\server.properties

kafka-server-startNext, Create a Topic to post messages using the following command.

.\bin\windows\kafka-create-topic.bat --zookeeper localhost:2181 --replica 1 --partition 1 --topic test

kafka-topic
You can check the list of topics by using the following command.
.\bin\windows\kafka-list-topic.bat --zookeeper localhost:2181
List-topics

On Getting Success message, next start to post message on kafka cluster.Before that , start the console-producer by using the command.

.\bin\windows\kafka-console-producer.bat --broker-list localhost:9092 --topic test


SendMessage
Next, start the console-consumer by executing the following command.

.\bin\windows\kafka-console-consumer.bat --zookeeper localhost:2181 --topic test --from-beginning

Kafka-HDIThe following screenshot displays the demo of running Apache Kafka-0.8 clusters(Producers & Consumers) on Azure Hbase HDI 3.1 cluster.
 

An OverView of HDInsight (Hadoop+HBase) with Integrated PowerShell along with R


Recently, while started the work with Predictive Analytic s with Machine Learning & R , felt the necessity of integration of Azure HDInsight-HBase with Azure ML features. In this demo, we ‘ll go through few basic understandings of operations on HDInsight(Hadoop) on Azure with PowerShell 0.8.6.

To start with, first we need to create an azure storage account which must be in same datacenter (e.g SouthEast Asia for this demo) of HDInsight cluster.


StorageAccount

You need also create a blob container & storage context object in order to copy raw data (e.g Click Stream data, log data, machine-sensor data) to local drive to azure storage account.


StorageAcc


To Copy data from local drive to Azure Storage container , use the following script.

CopyDataToBlob


Next, we need to provision the HDInsight cluster , for that need to execute the following script.

ProvisioningCluster

Upon, executing the script, the cluster provisioning is started from accept, configuring , provisioning phase. You need to assign the username & password manually.

HDInsightProvision

ClusterProvisioned


Next, check in Azure management portal after few mins, the provisioning have been started.

Portal

Details of HDInsight cluster provisioning along with running HQL queries is stored in my github repository. You can get it here.

Now, HBase columnar storage is available as a part of hadoop cluster from HDInsight offerings, so while provisioning cluster from portal , you need the corresponding cluster type – HBase or Hadoop.

HBase

Both of cluster type(either HBase or Hadoop) of HDInsight 3.1 is completely based of pure Hortonworks HDP 2.1 clusters which contains the hadoop components of the following version.

  • Apache Hadoop 2.4
  • Apache HBase 0.98.0
  • Apache Pig 0.12.1
  • Apache Hive 0.13.0
  • Apache Tez 0.4
  • Apache ZooKeeper 3.4.5
  • Hue 2.3.1
  • Storm 0.9.1
  • Apache Oozie 4.0.0
  • Apache Falcon 0.5
  • Apache Sqoop 1.4.4
  • Apache Knox 0.4
  • Apache Flume 1.4.0
  • Apache Accumulo 1.5.1
  • Apache Phoenix 4.0.0
  • Apache Avro 1.7.4
  • Apache Mahout 0.9.0
  • Third party components:
    • Ganglia 3.5.0
    • Ganglia Web 3.5.7
    • Nagios 3.5.0


    For Big Data analytics world , one of the most fine-grained language that supports now with Azure ML is R. You can install R official packages for Windows, Linux & OS X, also for official project perspective , use R IDE.

    R Packages:

    R packages are self-contained units of R functionality that can be invoked as functions. A good analogy would be a .jar file in Java. There is a vast library of
    R packages available for a very wide range of operations ranging from statistical operations and machine learning to rich graphic visualization and plotting. Every package will consist of one or more R functions. An R package is a re-usable entity that can be shared and used by others. R users can install the package that contains the functionality they are looking for and start calling the functions in the package. A comprehensive list of these packages can be found at http://cran.r-project.org/ called Comprehensive R Archive Network (CRAN).

    Data Modelling with R:

    Regression: In statistics, regression is a classic technique to identify the scalar relationship between two or more variables by fitting the state line on the
    variable values. That relationship will help to predict the variable value for future events. For example, any variable y can be modeled as linear function
    of another variable x with the formula y = mx+c. Here, x is the predictor variable, y is the response variable, m is slope of the line, and c is the
    intercept. Sales forecasting of products or services and predicting the price of stocks can be achieved through this regression. R provides this regression
    feature via the lm method, which is by default present in R.
    Classification: This is a machine-learning technique used for labeling the set of observations provided for training examples. With this, we can classify
    the observations into one or more labels. The likelihood of sales, online fraud detection, and cancer classification (for medical science) are common
    applications of classification problems. Google Mail uses this technique to classify e-mails as spam or not. Classification features can be served by glm,
    glmnet, ksvm, svm, and randomForest in R.
    Clustering: This technique is all about organizing similar items into groups from the given collection of items. User segmentation and image
    compression are the most common applications of clustering. Market segmentation, social network analysis, organizing the computer clustering,
    and astronomical data analysis are applications of clustering. Google News uses these techniques to group similar news items into the same category.
    Clustering can be achieved through the knn, kmeans, dist, pvclust, and Mclust methods in R.

    Recommendation: The recommendation algorithms are used in recommender systems where these systems are the most immediately recognizable machine learning techniques in use today. Web content recommendations may include similar websites, blogs, videos, or related content. Also, recommendation of online items can be helpful for cross-selling and up-selling. We have all seen online shopping portals that attempt to recommend books, mobiles, or any items that can be sold on the Web based on the user’s past behavior. Amazon is a well-known e-commerce portal that generates 29 percent of sales through recommendation systems. Recommender systems can be implemented via Recommender()with the recommenderlab package in R.