The Azure Data Catalog (aka previously PowerBI Data Catalog) has released in public preview on last monday(July 13th) @WPC15, which typically reveals a new world of storing & connecting #Data across on-prem & azure SQL database. Lets hop into a quick jumpstart on it.
Connect through Azure Data Catalog through this url https://www.azuredatacatalog.com/ by making sure you are logging with your official id & a valid Azure subscription. Currently , it’s free for first 50 users & upto 5000 registered data assets & in standard edition, upto 100 users & available upto 1M registered data assets.
Lets start with the signing of the official id into the portal.
Once it’s provisioned, you will be redirected to this page to launch a windows app of Azure Data Catalog.
It would start downloading the app from clickonce deployed server.
After it downloaded & would prompt to select server , at this point it has capacity to select data from SQL Server Analysis service, Reporting Service, on-prem/Azure SQL database & Oracle db.
For this demo, we used on-prem SQL server database to connect to Azure Data Catalog.
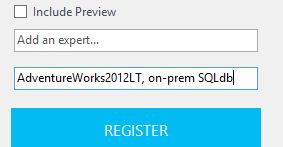
We selected here ‘AdventureWorksLT’ database & pushed total 8 tables like ‘Customer’, ‘Product’, ‘ProductCategory’, ‘ProductDescription’,’ProductModel’, ‘SalesOrderDetail’ etc. Also, you can tags to identify the datasets on data catalog portal.
Next, click on ‘REGISTER’ to register the dataset & optionally, you can include a preview of the data definition as well.
Once the object registration is done, it would allow to view on portal. Click on ‘View Portal’ to check the data catalogs.
Once you click , you would be redirected to data catalog homepage where you can search for your data by object metaname.
in the data catalog object portal, all of the registered metadata & objects would be visible with property tags.
You can also open the registered object datasets in excel to start importing into PowerBI.
Click on ‘Excel’ or ‘Excel(Top 1000)’ to start importing the data into Excel. The resultant data definition would in .odc format.
Once you open it in Excel, it would be prompted to enable custom extension. Click on ‘Enable’.
From Excel, the dataset is imported to latest Microsoft PowerBI Designer Preview app to build up a custom dashboard.
Login into https://app.powerbi.com & click to ‘File’ to get data from .pbix file.
Import the .pbix file on ‘AdventureWorks’ customer details & product analytics to powerbi reports & built up a dashboard.
The PowerBI preview portal dashboard has some updates on tile details filter like extension of custom links.
The PowerBI app for Android is available now, which is useful for quick glance of real-time analytics dashboards specially connected with Stream analytics & updating real time.
As per as the last demo on IoT foundation stuffs, we’ve seen how it’s possible to leverage the real-time data insights from social media datasets like Twitter with some keywords. In this demo, we are trying to pushing realtime sensors data from Windows Phone device to Azure Stream Analytics (through Service Bus EventHub channels) & after processing in ASA hub publishing out to realtime PowerBI dashboard or near real-time analytics(NRT) on PowerView for Excel by pushing out ASA events to Azure SQL database through Excel PowerQuery.
An overview of n-tier architecture of ASA on IoT foundation is like this:
While, IoT always enables customers to connect their own device on Azure cloud platform & bring out some real business value from it, whether it produces #BigData or #SmallData.
Another topic is pretty important is to get insights from Weblogs or telemetry data which can bring out good sentiment, click stream analytics values with machine learning.
Here goes a good high level discussion from IoT team.
Coming back to the demo, so, first implemented a sample app for generating Accelerometer 3D events (X, Y, Z) on Windows Phone & Windows Store devices(Universal app) & pushing the generated events as block blob to Azure Service Bus Event Hub.
//read column names
string[] colFields = csvReader.ReadFields();
foreach (string column in colFields)
{
DataColumn datecolumn = new DataColumn(column);
datecolumn.AllowDBNull = true;
csvData.Columns.Add(datecolumn);
}
while (!csvReader.EndOfData)
{
string[] fieldData = csvReader.ReadFields();
for (int i = 0; i < fieldData.Length; i++)
{
if (fieldData[i] == “”)
{
fieldData[i] = null;
}
}
csvData.Rows.Add(fieldData);
}
}
}
catch (Exception ex)
{
}
return csvData;
}
Now, built out ASA SQL query with specific window interval like in this demo, used ‘SlidingWindow(Second,no of interval)’ which generates computation on event hubs data based on the specific time interval mentioned in window.
Next, start implement the processed output visualization on PowerBI preview portal by selecting ‘Output’ tab of ASA job. Once, you provide all the dataset name of output & start the ASA job, on PowerBI portal, would be able to see the specific dataset is created with a small yellow star icon beside.
Here goes a step by step demonstration with video available on my Youtube channel.


You must be logged in to post a comment.