What’s new in Azure Data Catalog


The Azure Data Catalog (aka previously PowerBI Data Catalog) has released in public preview on last monday(July 13th) @WPC15, which typically reveals a new world of storing & connecting #Data across on-prem & azure SQL database. Lets hop into a quick jumpstart on it.

Connect through Azure Data Catalog through this url  https://www.azuredatacatalog.com/ by making sure you are logging with your official id & a valid Azure subscription. Currently , it’s free for first 50 users & upto 5000 registered data assets & in standard edition, upto 100 users & available upto 1M registered data assets.

Provision


Lets start with the signing of the official id into the portal.

Signin

Once it’s provisioned, you will be redirected to this page to launch a windows app of Azure Data Catalog.

AzureDC


It would start downloading the app from clickonce deployed server.

ADCapp


After it downloaded & would prompt to select server , at this point it has capacity to select data from SQL Server Analysis service, Reporting Service, on-prem/Azure SQL database & Oracle db.

Servers

For this demo, we used on-prem SQL server database to connect to Azure Data Catalog.

Catalog

We selected here ‘AdventureWorksLT’ database & pushed total 8 tables like ‘Customer’, ‘Product’, ‘ProductCategory’, ‘ProductDescription’,’ProductModel’, ‘SalesOrderDetail’ etc. Also, you can tags to identify the datasets on data catalog portal.

metadata-tag

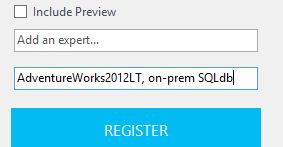
Next, click on ‘REGISTER’ to register the dataset & optionally, you can include a preview of the data definition as well.

Object-registration


Once the object registration is done, it would allow to view on portal. Click on ‘View Portal’ to check the data catalogs.

Portal

Once you click , you would be redirected to data catalog homepage where you can search for your data by object metaname.

Search


SearchData

in the data catalog object portal, all of the registered metadata & objects would be visible with property tags.

Properties

You can also open the registered object datasets in excel to start importing into PowerBI.

opendata

Click on ‘Excel’ or ‘Excel(Top 1000)’ to start importing the data into Excel. The resultant data definition would in .odc format.

SaveCustomer


Once you open it in Excel, it would be prompted to enable custom extension. Click on ‘Enable’.

Security

From Excel, the dataset is imported to latest Microsoft PowerBI Designer Preview app to build up a custom dashboard.

ADC-PowerBI

Login into https://app.powerbi.com & click to ‘File’ to get data from .pbix file.

PowerBI

Import the .pbix file on ‘AdventureWorks’ customer details & product analytics to powerbi reports & built up a dashboard.Uploading

The PowerBI preview portal dashboard has some updates on tile details filter like extension of custom links.

PowerBI-filter


The PowerBI app for Android is available now, which is useful for quick glance of real-time analytics dashboards specially connected with Stream analytics & updating  real time.

WP_20150715_14_07_48_Pro

WP_20150715_14_13_33_Pro

AdventureWorks-ADC


Microsoft IoT Foundation: Realtime Tweets Streaming into Azure Stream Analytics with PowerBI & PowerBI Designer Preview


The Azure Stream Analytics(ASA) is one of the major component of Microsoft #IoT foundation which has got ‘PowerBI‘ as its output connector for visualization of realtime data streaming into Event hub to Stream Analytics hub, just one month back as ‘public preview’.

In this demo, we’re going to focus to end to end realtime Tweets analytics collecting through Java code using ‘Twitter4j’ library, then store it into OneDrive storage as .csv file as well as storing it into Azure storage as block blob. Then, sending realtime tweets streamed into Service Bus Event Hubs for processing , so, after creating the stream analytics job make sure that the input connector is properly selected as data stream for ‘event hub’, then process ASA SQL query with specific ‘HoppingWindow(second,3) & ‘SlidingWindow(Minute,10,5) with overlapping/non-overlapping window frame of data streaming.

Finally , select the output connector as PowerBI & authorize with your organisational account. Once, your ASA job starts running, you would be able to see the powerbi dataset which you have selected as powerbi output dataset name, start building the ASA connected PowerBI report & Dashboard.

First, a good amount of real tweets are collected based on the specific keywords like #IoT, #BigData, #Analytics, #Windows10, #Azure, #ASA, #HDI, #PowerBI, #AML, #ADF etc.

The sample tweets are looks like this

DateTime,TwitterUserName,ProfileLocation,MorePreciseLocation,Country,TweetID
06/24/2015 07:25:19,CodeNotFound,France,613714525431418880
06/24/2015 07:25:19,sinequa,Paris – NY- London – Frankfurt,613714525385289728
06/24/2015 07:25:20,RavenBayService,Calgary, Alberta,613714527302098944
06/24/2015 07:25:20,eleanorstenner,,613714530112274432
06/24/2015 07:25:21,ISDI_edu,,613714530758230016
06/24/2015 07:25:23,muthamiphilo,Kenya,613714541562740736
06/24/2015 07:25:23,tombee74,ÜT: 48.88773,2.23806,613714541931851776
06/24/2015 07:25:25,EricLibow,,613714547975790592

Now,  the data is sent to event hub for realtime processing & we’ve written the ASA-SQL like this.

CREATE TABLE input(
DateTime nvarchar(MAX),
TwitterUserName nvarchar(MAX),
ProfileLocation nvarchar(MAX),
MorePreciseLocation nvarchar(MAX),
Country nvarchar(MAX),
TweetID nvarchar(MAX))
SELECT input.DateTime, input.TwitterUserName,input.ProfileLocation,
input.MorePreciseLocation,input.Country,count(input.TweetID) as TweetCount
INTO output
FROM input Group By input.DateTime, input.TwitterUserName,input.ProfileLocation,input.MorePreciseLocation,
input.Country, SlidingWindow(second,10)

Output

Authorize

Next, start build up the PowerBI report on PowerBI preview portal. Once you build the Dashboard with report by pinning the graphs, it would like something like this.

IoTAnalytics

Analytics

You could be able to visualize the realtime update of data like #total tweet counts on the specific keywords, #total twitterusername tweeted , #total tweetloation etc.

WorldwideTweet

In another demo, we’ve used the PowerBI Designer preview tool by collecting processed tweets coming out from ASA hub to ‘Azure Blob Storage’ & then picking it into ‘PowerBI Designer Preview’.

PBIDesigner

In latest PBI , we’ve got support of combo stacked chart, which we’ve utilized to depict #average tweetcount of those specific keywords by location & timeframe for few minutes & seconds interval.

TweetComboStacked

Also, you could support for well end PowerQ&A features as well like ‘PowerBI for Office 365’ which has natural language processing (NLP) backed by Azure Machine Learning processing power enabled.

like if I throw a question on these realworld streaming dataset on PowerQ&A

show tweetcount where profilelocation is bayarea & London, Auckland, India, Bangalore,Paris as stacked column chart

PowerQ&A

After that, save the PBI designer file as .pbix & upload into www.powerbi.com , under get data->Local File section. It has got support for uploading PBI designer file as well as data source connector.

PBI

Upon uploading, built out the dashboard which has got facility of schedule refresh on preview portal itself. Right click on your PBI report on portal, select settings to open the schedule refresh page.

Settings

ScheduleRefresh

Here goes the realtime scheduled refresh dashboard of Twitter IoT Analytics on realtime tweets.

PBI-Portal

The same PBI dashboards can be visualized from the ‘PowerBI app for Windows Store or iOS’ . Here goes a demonstration.

WP_20150624_22_21_52_Pro

WP_20150624_22_22_20_Pro