Azure Stream Analytics & Machine Learning Integration With RealTime Twitter Sentiment Analytics Dashboard on PowerBI


Recently, it has been introduced the integration of ASA & AML available as preview update & it’s possible to add AML web service URL & API key as ‘custom function‘ with ASA input. In this demo, realtime tweets are collected based on keywords like ‘#HappyHolidays2016‘, ‘#MerryChristmas‘, ‘#HappyNewYear2016‘ & those are directly stored on a .csv file saved on OneDrive. Here goes the solution architecture diagram of the POC.

SolutionArc


Now, add the Service Bus event hub endpoint as input to the ASA job, while deploy the ‘Twitter Predictive Sentiment Analytics Model‘  & click on ‘Open in Studio‘ to start deploy the model. Don’t forget to run the solution before deploying.

AML


Once the model is deployed, open the ‘Web Service‘ dashboard page to get the model URL & API key, click on default endpoint -> download the excel 2010 or earlier apps. Collect the URL & API key to apply it to ASA function credentials for AML deployment.

DeployedAML

Next, create an ASA job & add the event hub credentials where the real world tweets are getting pushed & click on ‘Functions‘ tab of ASA job to add the AML credentials. Provide model name, URL & API key of the model & Once, it’s added, click on Save.

ASA-Functions


Now, add the following ASA SQL to aggregate the realtime tweets sentiment scores coming out from predictive twitter sentiment model.

Query


Provide the output as Azure Blob storage, add a container name & serialization type as CSV & start the ASA job. Also, start importing data into PowerBI desktop from the ASA output Azure blob storage account.

Output


PowerBI desktop contains in-built power Query to start preparing the ASA output data & processing data types. Choose the AML model sentiment score datatype as decimal type & TweetTexts as Text(String) type.

PBI-AML


Start building the ‘Twitter Sentiment Analytics‘ dashboard powered by @AzureStreaming & Azure Machine Learning API with realworld tweet streaming, there’re some cool custom visuals are available on PowerBI.  I’ve used some visuals here like ‘wordcloud‘ chart which depicts some of the highly scored positive sentiment contained tweets with most specific keywords like ‘happynewyear2016‘, ‘MerryChristmas‘,’HappyHolidays‘ etc.

PBI-visuals


While, in the donut chart, the top 10 tweets with most positive sentiment counts are portrayed with the specific sentiment scores coming from AML predictive model experiment integrated with ASA jobs.

PBI-dashboard

~Wish you HappyHolidays 2016!

A lap around Microsoft Azure IoT Hub with Azure Stream Analytics & IoT Analytics Suite


Last month on #AzureConf 2015, the Azure IoT Suite has been announced to be available for purchase along with the GA release of Azure IoT Hub. The IoT Hub helps to control, monitor & connect thousands of devices to communicate via cloud & talk to each other using suitable protocols. You can connect to your Azure IoT Hub using the IoT Hub SDKs available in different languages like C, C#, Java, Ruby etc. Also, there’re monitoring devices available like device explorer or iothub-explorer. In this demo, Weather Data Analytics is demonstrated using Azure IoT Hub with Stream Analytics powered by Azure IoT Suite & visualized using Azure SQL database with PowerBI.

You can provision your own device into Azure IoT analytics Suite using device explorer or iothub-explorer tool & start bi-directional communication through device-cloud & cloud-device.

First, create your Azure IoT Hub from Azure Preview Portal  by selecting New-> Internet of Things -> Azure IoT Hub. Provide hub name, select pricing & scale tier[F1 – free(1/subscription, connect 10 devices, 3000 messages /day), [S1 – standard (50,000 messages/day) & S2- standard(1.5 M messages/day)] for device to cloud communication. Select IoT Hub units, device to cloud partitions, resource group, subscription & finally location of deployment(currently it’s available only in three locations- ‘East Asia’, ‘East US’, ‘North Europe’.


IoThubcreate


Once the hub is created, next switch to device explorer to start creating a device, for details about to create a device & register, refer to this Github page. After registering the device, move back to  ‘Data‘ tab of device explorer tool & click on ‘Monitor‘ button to start receive device-cloud events sent to Azure IoT Hub from device.

DeviceExplorer


The schema for the weather dataset looks like the following data & fresh data collected from various sensors & feed into Azure IoT Hub which can be viewed using Device Explorer tool.

DataSchema


In order to push data from weather data sensor device to Azure IoT hub, the following code snippet needs to be used. The full code-snipped is going to be available on my Github page.


using System;
using System.Text;
using System.Threading.Tasks;
using System.IO;
using System.Data;
using Newtonsoft.Json;
using Microsoft.VisualBasic;
using Microsoft.VisualBasic.FileIO;

namespace Microsoft.Azure.Devices.Client.Samples
{
class Program
{
private const string DeviceConnectionString = “Your device connection-string”;
private static int MESSAGE_COUNT = 5;
static string data = string.Empty;

static void Main(string[] args)
{
try
{
DeviceClient deviceClient = DeviceClient.CreateFromConnectionString(DeviceConnectionString);

if (deviceClient == null)
{
Console.WriteLine(“Failed to create DeviceClient!”);
}
else
{
SendEvent(deviceClient).Wait();
ReceiveCommands(deviceClient).Wait();
}

Console.WriteLine(“Exited!\n”);
}
catch (Exception ex)
{
Console.WriteLine(“Error in sample: {0}”, ex.Message);
}
}

static async Task SendEvent(DeviceClient deviceClient)
{
string[] filePath = Directory.GetFiles(@”\Weblog\”,”*.csv”);
string csv_file_path = string.Empty;
int size = filePath.Length;
for(int i=0; i< size; i++)
{
Console.WriteLine(filePath[i]);
csv_file_path = filePath[i];
}

DataTable csvData = GetDataTableFromCSVFile(csv_file_path);
Console.WriteLine(“Rows count:” + csvData.Rows.Count);
DataTable table = csvData;
foreach(DataRow row in table.Rows)
{
foreach(var item in row.ItemArray)
data = item.ToString();
Console.Write(data);

try
{
foreach(DataRow rows in table.Rows)
{
var info = new WeatherData
{
weatherDate = rows.ItemArray[0].ToString(),
weatherTime = rows.ItemArray[1].ToString(),
apperantTemperature = rows.ItemArray[2].ToString(),
cloudCover = rows.ItemArray[3].ToString(),
dewPoint = rows.ItemArray[4].ToString(),
humidity = rows.ItemArray[5].ToString(),
icon = rows.ItemArray[6].ToString(),
pressure = rows.ItemArray[7].ToString(),
temperature = rows.ItemArray[8].ToString(),
timeInterval = rows.ItemArray[9].ToString(),
visibility = rows.ItemArray[10].ToString(),
windBearing = rows.ItemArray[11].ToString(),
windSpeed = rows.ItemArray[12].ToString(),
latitude = rows.ItemArray[13].ToString(),
longitude = rows.ItemArray[14].ToString()
};

var serializedString = JsonConvert.SerializeObject(info);
var message = data;
Console.WriteLine(“{0}> Sending events: {1}”, DateTime.Now.ToString(), serializedString.ToString());
await deviceClient.SendEventAsync(new Message(Encoding.UTF8.GetBytes(serializedString.ToString())));
}
}

catch(Exception ex)
{
Console.ForegroundColor = ConsoleColor.Red;
Console.WriteLine(“{0} > Exception: {1}”, DateTime.Now.ToString(), ex.Message);
Console.ResetColor();
}
// Task.Delay(200);

}

Console.WriteLine(“Press Ctrl-C to stop the sender process”);
Console.WriteLine(“Press Enter to start now”);
Console.ReadLine();

//string dataBuffer;

//Console.WriteLine(“Device sending {0} messages to IoTHub…\n”, MESSAGE_COUNT);

//for (int count = 0; count < MESSAGE_COUNT; count++)
//{
// dataBuffer = Guid.NewGuid().ToString();
// Message eventMessage = new Message(Encoding.UTF8.GetBytes(dataBuffer));
// Console.WriteLine(“\t{0}> Sending message: {1}, Data: [{2}]”, DateTime.Now.ToLocalTime(), count, dataBuffer);

// await deviceClient.SendEventAsync(eventMessage);
//}
}

private static DataTable GetDataTableFromCSVFile(string csv_file_path)
{
DataTable csvData = new DataTable();
string data = string.Empty;
try
{
using (TextFieldParser csvReader = new TextFieldParser(csv_file_path))
{
csvReader.SetDelimiters(new string[] { “,” });
csvReader.HasFieldsEnclosedInQuotes = true;

//read column names
string[] colFields = csvReader.ReadFields();
foreach (string column in colFields)
{
DataColumn datecolumn = new DataColumn(column);
datecolumn.AllowDBNull = true;
csvData.Columns.Add(datecolumn);
}
while (!csvReader.EndOfData)
{
string[] fieldData = csvReader.ReadFields();

for (int i = 0; i < fieldData.Length; i++)
{
if (fieldData[i] == “”)
{
fieldData[i] = null;
}
}
csvData.Rows.Add(fieldData);

}
}
}
catch (Exception ex)
{
Console.WriteLine(“Exception” + ex.Message);
}
return csvData;
}

static async Task ReceiveCommands(DeviceClient deviceClient)
{
Console.WriteLine(“\nDevice waiting for commands from IoTHub…\n”);
Message receivedMessage;
string messageData;

while (true)
{
receivedMessage = await deviceClient.ReceiveAsync(TimeSpan.FromSeconds(1));

if (receivedMessage != null)
{
messageData = Encoding.ASCII.GetString(receivedMessage.GetBytes());
Console.WriteLine(“\t{0}> Received message: {1}”, DateTime.Now.ToLocalTime(), messageData);

await deviceClient.CompleteAsync(receivedMessage);
}
}
}
}
}

You could check output to events sending from device to cloud on console.

dataconsole

Next, start pushing the device data into Azure IoT Hub & monitor the events receiving process through device explorer. Now, start provisioning an Azure Stream Analytics Job on Azure portal. Provide ‘Azure IoT Hub‘ as an input to the job like as the followings.

SAJob


input

IoTHubinput

Now provide Azure Stream Analytics Query to connect incoming unstructured datasets from device to cloud to pass into Azure SQL database. So, first, provision a SQL database on Azure & connect to as output to Stream Analytics job.

create table input(
weatherDate nvarchar(max),
weatherTime datetime,
apperantTemperature nvarchar(max),
cloudCover nvarchar(max),
dewPoint nvarchar(max),
humidity nvarchar(max),
icon nvarchar(max),
pressure nvarchar(max),
temperature nvarchar(max),
timeInterval nvarchar(max),
visibility nvarchar(max),
windBearing nvarchar(max),
windSpeed nvarchar(max),
latitude nvarchar(max),
longitude nvarchar(max)
)
select input.weatherDate, input.weatherTime,input.apperantTemperature,input.cloudCover,
input.dewPoint, input.humidity,input.icon,input.pressure,count(input.temperature) as avgtemperature, input.timeInterval, input.visibility, input.windBearing,
input.windSpeed,input.latitude,input.longitude

into weathersql
from input
group by input.weatherDate, input.weatherTime, input.apperantTemperature,input.cloudCover,
input.dewPoint, input.humidity,input.icon, input.pressure,input.timeInterval,input.visibility, input.windBearing,
input.windSpeed,input.latitude,input.longitude, TumblingWindow(second,2)

ASA-sql

Specify the output of ‘WeatherIoT’ ASA job as ‘Azure SQL Database‘, alternatively, you can select any of the rest of the connectors like ‘Event Hub’, ‘DocumentDB’ etc.

SAOutput


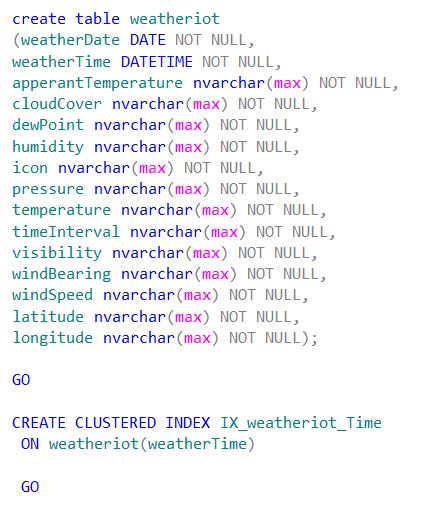
Make sure that , to create the necessary database & table first on SQL before adding as output to ASA job. For this demo, I have created the ‘weatheriot‘ table on Azure SQL database. The t-sql query looks like this.

iotsql


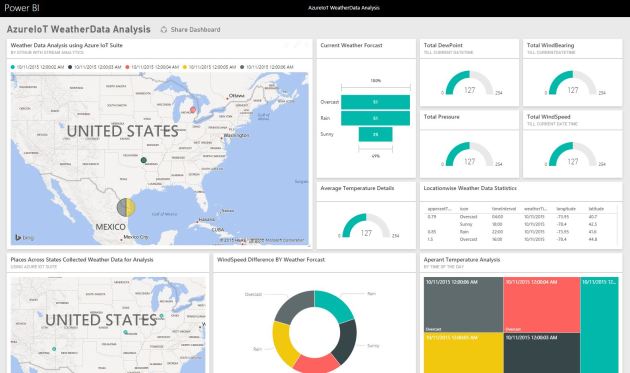
Next, start the ASA job & receive the final Azure IoT hub(device to cloud) data processed to IoT hub ->ASA -> Azure SQL database pipeline. Once you receive data on your Azure SQL table. Start building the PowerBI ‘Weather IoT Data Analytics’ dashboard for visualization & to leverage the power of Azure IoT momentum.

SQLoutput

Connect to PowerBI connected through same account of Azure subscription where you provisioned the ASA job & start importing data from Azure SQL database. Create stunning reports using funnel, donut, global map charts with live data refresh.

WeatherData

For this demo, I’ve populated charts on average weather temperature, pressure, humidity, dew point forecasting analysis over specific areas based on latitude & longitude values, plotted & pinned into PowerBI ‘Weather Data Azure IoT Analytics’ dashboard.

WeatherData-analysis


What’s new in Azure Data Catalog


The Azure Data Catalog (aka previously PowerBI Data Catalog) has released in public preview on last monday(July 13th) @WPC15, which typically reveals a new world of storing & connecting #Data across on-prem & azure SQL database. Lets hop into a quick jumpstart on it.

Connect through Azure Data Catalog through this url  https://www.azuredatacatalog.com/ by making sure you are logging with your official id & a valid Azure subscription. Currently , it’s free for first 50 users & upto 5000 registered data assets & in standard edition, upto 100 users & available upto 1M registered data assets.

Provision


Lets start with the signing of the official id into the portal.

Signin

Once it’s provisioned, you will be redirected to this page to launch a windows app of Azure Data Catalog.

AzureDC


It would start downloading the app from clickonce deployed server.

ADCapp


After it downloaded & would prompt to select server , at this point it has capacity to select data from SQL Server Analysis service, Reporting Service, on-prem/Azure SQL database & Oracle db.

Servers

For this demo, we used on-prem SQL server database to connect to Azure Data Catalog.

Catalog

We selected here ‘AdventureWorksLT’ database & pushed total 8 tables like ‘Customer’, ‘Product’, ‘ProductCategory’, ‘ProductDescription’,’ProductModel’, ‘SalesOrderDetail’ etc. Also, you can tags to identify the datasets on data catalog portal.

metadata-tag

Next, click on ‘REGISTER’ to register the dataset & optionally, you can include a preview of the data definition as well.

Object-registration


Once the object registration is done, it would allow to view on portal. Click on ‘View Portal’ to check the data catalogs.

Portal

Once you click , you would be redirected to data catalog homepage where you can search for your data by object metaname.

Search


SearchData

in the data catalog object portal, all of the registered metadata & objects would be visible with property tags.

Properties

You can also open the registered object datasets in excel to start importing into PowerBI.

opendata

Click on ‘Excel’ or ‘Excel(Top 1000)’ to start importing the data into Excel. The resultant data definition would in .odc format.

SaveCustomer


Once you open it in Excel, it would be prompted to enable custom extension. Click on ‘Enable’.

Security

From Excel, the dataset is imported to latest Microsoft PowerBI Designer Preview app to build up a custom dashboard.

ADC-PowerBI

Login into https://app.powerbi.com & click to ‘File’ to get data from .pbix file.

PowerBI

Import the .pbix file on ‘AdventureWorks’ customer details & product analytics to powerbi reports & built up a dashboard.Uploading

The PowerBI preview portal dashboard has some updates on tile details filter like extension of custom links.

PowerBI-filter


The PowerBI app for Android is available now, which is useful for quick glance of real-time analytics dashboards specially connected with Stream analytics & updating  real time.

WP_20150715_14_07_48_Pro

WP_20150715_14_13_33_Pro

AdventureWorks-ADC


Pushing realtime Sensors data into ASA & visualize into Near Real-Time (NRT) PowerBI dashboard– frontier of IoT


As per as the last demo on IoT foundation stuffs, we’ve seen how it’s possible to leverage the real-time data insights from social media datasets like Twitter with some keywords. In this demo, we are trying to pushing realtime sensors data from Windows Phone device to Azure Stream Analytics (through Service Bus EventHub channels) & after processing in ASA hub publishing out to realtime PowerBI dashboard or near real-time analytics(NRT) on PowerView for Excel by pushing out ASA events to Azure SQL database through Excel PowerQuery.

An overview of n-tier architecture of  ASA on IoT foundation is like this:

ASA-blog


While, IoT always enables customers to connect their own device on Azure cloud platform & bring out some real business value from it, whether it produces #BigData or #SmallData.

Another topic is pretty important is to get insights from Weblogs or telemetry data which can bring out good sentiment, click stream analytics values with machine learning.

Here goes a good high level discussion from IoT team.

Coming back to the demo, so, first implemented a sample app for generating Accelerometer 3D events (X, Y, Z) on Windows Phone & Windows Store devices(Universal app) & pushing the generated events as block blob to Azure Service Bus Event Hub.

Attached sample code snippet.

private async void ReadingChanged(object sender, AccelerometerReadingChangedEventArgs e)
{

await Dispatcher.RunAsync(CoreDispatcherPriority.Normal, () =>
{
AccelerometerReading reading = e.Reading;
ScenarioOutput_X.Text = String.Format(“{0,5:0.00}”, reading.AccelerationX);
ScenarioOutput_Y.Text = String.Format(“{0,5:0.00}”, reading.AccelerationY);
ScenarioOutput_Z.Text = String.Format(“{0,5:0.00}”, reading.AccelerationZ);
i++;

//Coordinate_X = String.Format(“{0,5:00.00}”,Coordinate_X + ScenarioOutput_X.Text);
//Coordinate_Y = String.Format(“{0,5:00.00}”, Coordinate_Y + ScenarioOutput_Y.Text);
//Coordinate_Z = String.Format(“{0,5:00.00}”, Coordinate_Z + ScenarioOutput_Z.Text);
dataDetails = i +”,”+ reading.AccelerationX + “,” + reading.AccelerationY + “,” + reading.AccelerationZ;

NewDataFile += Environment.NewLine + dataDetails;

});
CloudStorageAccount storageAccount = CloudStorageAccount.Parse(“DefaultEndpointsProtocol=https;AccountName=yourazurestorageaccountname;

AccountKey=yourazurestorageaccountkey”);

CloudBlobClient blobClient = storageAccount.CreateCloudBlobClient();

CloudBlobContainer container = blobClient.GetContainerReference(“accelerometer”);
await container.CreateIfNotExistsAsync();
//if (x == false)
//{
// await container.CreateAsync();
//}

CloudBlockBlob blockBlob = container.GetBlockBlobReference(newFileName);
// bool y = await blockBlob.ExistsAsync();
//if (!blockBlob.Equals(newFileName))
//{
container.GetBlockBlobReference(newFileName);
// await blockBlob.UploadTextAsync(dataDetails);

await blockBlob.UploadTextAsync(Headers + Environment.NewLine+ NewDataFile);
}


You can download the whole visual studio solution on Github.

BUILD-Kevin-thumbnail-IoT

Next challenge as usual is to send real sensor events to event hubs with accurate consumer key & publish millions of events to event hub at a time.

Here goes sample code snippet.

class Program
{
static string eventHubName = “youreventhubname”;
static string connectionString = GetServiceBusConnectionString();
static string data = string.Empty;
static void Main(string[] args)
{

string csv_file_path = string.Empty;
install();
//string csv_file_path = @””;
string[] filePath = Directory.GetFiles(@”Your CSV Sensor Data file directory”, “*.csv”);
int size = filePath.Length;
for (int i = 0; i < size; i++)
{
Console.WriteLine(filePath[i]);
csv_file_path = filePath[i];
}

DataTable csvData = GetDataTableFromCSVFile(csv_file_path);
Console.WriteLine(“Rows count:” + csvData.Rows.Count);
DataTable table = csvData;
foreach (DataRow row in table.Rows)
{
// Console.WriteLine(“—Row—“);
foreach (var item in row.ItemArray)
{

data = item.ToString();
Console.Write(data);

var eventHubClient = EventHubClient.CreateFromConnectionString(connectionString, eventHubName);
//while (true)
//{

try
{
foreach (DataRow rows in table.Rows)
{
var info = new Accelerometer
{

ID = rows.ItemArray[0].ToString(),
Coordinate_X = rows.ItemArray[1].ToString(),
Coordinate_Y = rows.ItemArray[2].ToString(),
Coordinate_Z = rows.ItemArray[3].ToString()

};
var serializedString = JsonConvert.SerializeObject(info);
var message = data;
Console.WriteLine(“{0}> Sending events: {1}”, DateTime.Now.ToString(), serializedString.ToString());
eventHubClient.SendAsync(new EventData(Encoding.UTF8.GetBytes(serializedString.ToString())));

}
}
catch (Exception ex)
{
Console.ForegroundColor = ConsoleColor.Red;
Console.WriteLine(“{0} > Exception: {1}”, DateTime.Now.ToString(), ex.Message);
Console.ResetColor();
}
Task.Delay(200);
//}
}

}
// Console.ReadLine();

Console.WriteLine(“Press Ctrl-C to stop the sender process”);
Console.WriteLine(“Press Enter to start now”);
Console.ReadLine();

// SendingRandomMessages().Wait();

}

public static void install()
{
string url = @”https://…………blob.core.windows.net/accelerometer/AccelerometerSensorData.csv&#8221;;
WebClient wc = new WebClient();
wc.DownloadFileCompleted += new AsyncCompletedEventHandler(Completed);
wc.DownloadProgressChanged += new DownloadProgressChangedEventHandler(ProgressChanged);
// Console.WriteLine(“Download OnProgress……”);

ConsoleHelper.ProgressTitle = “Downloading”;
ConsoleHelper.ProgressTotal = 10;
for (int i = 0; i <= 10; i++)
{
ConsoleHelper.ProgressValue = i;
Thread.Sleep(500);
if (i >= 5)
{
ConsoleHelper.ProgressHasWarning = true;
}
if (i >= 8)
{
ConsoleHelper.ProgressHasError = true;
}
}
ConsoleHelper.ProgressTotal = 0;
try
{
wc.DownloadFile(new Uri(url), @”\ASA\Sensors\Accelerometer\AccelerometerSensorData.csv”);
}
catch (Exception ex)
{
while (ex != null)
{
Console.WriteLine(ex.Message);
ex = ex.InnerException;
}
}
}
public static void Completed(object sender, AsyncCompletedEventArgs e)
{
Console.WriteLine(“Download Completed!”);
}

public static void ProgressChanged(object sender, DownloadProgressChangedEventArgs e)
{
Console.WriteLine(“{0} Downloaded {1} of {2} bytes,{3} % Complete….”,
(string)e.UserState,
e.BytesReceived,
e.TotalBytesToReceive,
e.ProgressPercentage);
DrawProgressBar(0, 100, Console.WindowWidth, ‘1’);
}

private static void DrawProgressBar(int complete, int maxVal, int barSize, char ProgressCharacter)
{
Console.CursorVisible = false;
int left = Console.CursorLeft;
decimal perc = (decimal)complete / (decimal)maxVal;
int chars = (int)Math.Floor(perc / ((decimal)1 / (decimal)barSize));
string p1 = String.Empty, p2 = String.Empty;

for (int i = 0; i < chars; i++) p1 += ProgressCharacter;
for (int i = 0; i < barSize – chars; i++) p2 += ProgressCharacter;

Console.ForegroundColor = ConsoleColor.Green;
Console.Write(p1);
Console.ForegroundColor = ConsoleColor.DarkGreen;
Console.Write(p2);

Console.ResetColor();
Console.Write(“{0}%”, (perc * 100).ToString(“N2”));
Console.CursorLeft = left;
}
private static DataTable GetDataTableFromCSVFile(string csv_file_path)
{
DataTable csvData = new DataTable();
string data = string.Empty;
try
{
using (TextFieldParser csvReader = new TextFieldParser(csv_file_path))
{
csvReader.SetDelimiters(new string[] { “,” });
csvReader.HasFieldsEnclosedInQuotes = true;

//read column names
string[] colFields = csvReader.ReadFields();
foreach (string column in colFields)
{
DataColumn datecolumn = new DataColumn(column);
datecolumn.AllowDBNull = true;
csvData.Columns.Add(datecolumn);
}
while (!csvReader.EndOfData)
{
string[] fieldData = csvReader.ReadFields();

for (int i = 0; i < fieldData.Length; i++)
{
if (fieldData[i] == “”)
{
fieldData[i] = null;
}
}
csvData.Rows.Add(fieldData);

}
}
}
catch (Exception ex)
{

}
return csvData;
}


Now, built out ASA SQL query with specific window interval like in this demo, used ‘SlidingWindow(Second,no of interval)’ which generates computation on event hubs data based on the specific time interval mentioned in window.

ASAQuery


Next, start implement the processed output visualization on PowerBI preview portal by selecting ‘Output’ tab of ASA job. Once, you provide all the dataset name of output & start the ASA job, on PowerBI portal, would be able to see the specific dataset is created with a small yellow star icon beside.SensorsPowerBI


Here goes a step by step demonstration with video available on my Youtube channel.

Microsoft IoT Foundation: Realtime Tweets Streaming into Azure Stream Analytics with PowerBI & PowerBI Designer Preview


The Azure Stream Analytics(ASA) is one of the major component of Microsoft #IoT foundation which has got ‘PowerBI‘ as its output connector for visualization of realtime data streaming into Event hub to Stream Analytics hub, just one month back as ‘public preview’.

In this demo, we’re going to focus to end to end realtime Tweets analytics collecting through Java code using ‘Twitter4j’ library, then store it into OneDrive storage as .csv file as well as storing it into Azure storage as block blob. Then, sending realtime tweets streamed into Service Bus Event Hubs for processing , so, after creating the stream analytics job make sure that the input connector is properly selected as data stream for ‘event hub’, then process ASA SQL query with specific ‘HoppingWindow(second,3) & ‘SlidingWindow(Minute,10,5) with overlapping/non-overlapping window frame of data streaming.

Finally , select the output connector as PowerBI & authorize with your organisational account. Once, your ASA job starts running, you would be able to see the powerbi dataset which you have selected as powerbi output dataset name, start building the ASA connected PowerBI report & Dashboard.

First, a good amount of real tweets are collected based on the specific keywords like #IoT, #BigData, #Analytics, #Windows10, #Azure, #ASA, #HDI, #PowerBI, #AML, #ADF etc.

The sample tweets are looks like this

DateTime,TwitterUserName,ProfileLocation,MorePreciseLocation,Country,TweetID
06/24/2015 07:25:19,CodeNotFound,France,613714525431418880
06/24/2015 07:25:19,sinequa,Paris – NY- London – Frankfurt,613714525385289728
06/24/2015 07:25:20,RavenBayService,Calgary, Alberta,613714527302098944
06/24/2015 07:25:20,eleanorstenner,,613714530112274432
06/24/2015 07:25:21,ISDI_edu,,613714530758230016
06/24/2015 07:25:23,muthamiphilo,Kenya,613714541562740736
06/24/2015 07:25:23,tombee74,ÜT: 48.88773,2.23806,613714541931851776
06/24/2015 07:25:25,EricLibow,,613714547975790592

Now,  the data is sent to event hub for realtime processing & we’ve written the ASA-SQL like this.

CREATE TABLE input(
DateTime nvarchar(MAX),
TwitterUserName nvarchar(MAX),
ProfileLocation nvarchar(MAX),
MorePreciseLocation nvarchar(MAX),
Country nvarchar(MAX),
TweetID nvarchar(MAX))
SELECT input.DateTime, input.TwitterUserName,input.ProfileLocation,
input.MorePreciseLocation,input.Country,count(input.TweetID) as TweetCount
INTO output
FROM input Group By input.DateTime, input.TwitterUserName,input.ProfileLocation,input.MorePreciseLocation,
input.Country, SlidingWindow(second,10)

Output

Authorize

Next, start build up the PowerBI report on PowerBI preview portal. Once you build the Dashboard with report by pinning the graphs, it would like something like this.

IoTAnalytics

Analytics

You could be able to visualize the realtime update of data like #total tweet counts on the specific keywords, #total twitterusername tweeted , #total tweetloation etc.

WorldwideTweet

In another demo, we’ve used the PowerBI Designer preview tool by collecting processed tweets coming out from ASA hub to ‘Azure Blob Storage’ & then picking it into ‘PowerBI Designer Preview’.

PBIDesigner

In latest PBI , we’ve got support of combo stacked chart, which we’ve utilized to depict #average tweetcount of those specific keywords by location & timeframe for few minutes & seconds interval.

TweetComboStacked

Also, you could support for well end PowerQ&A features as well like ‘PowerBI for Office 365’ which has natural language processing (NLP) backed by Azure Machine Learning processing power enabled.

like if I throw a question on these realworld streaming dataset on PowerQ&A

show tweetcount where profilelocation is bayarea & London, Auckland, India, Bangalore,Paris as stacked column chart

PowerQ&A

After that, save the PBI designer file as .pbix & upload into www.powerbi.com , under get data->Local File section. It has got support for uploading PBI designer file as well as data source connector.

PBI

Upon uploading, built out the dashboard which has got facility of schedule refresh on preview portal itself. Right click on your PBI report on portal, select settings to open the schedule refresh page.

Settings

ScheduleRefresh

Here goes the realtime scheduled refresh dashboard of Twitter IoT Analytics on realtime tweets.

PBI-Portal

The same PBI dashboards can be visualized from the ‘PowerBI app for Windows Store or iOS’ . Here goes a demonstration.

WP_20150624_22_21_52_Pro

WP_20150624_22_22_20_Pro

Deployment of Apache Oozie 4.1.0 in Hadoop Cluster & schedule a MR job with Oozie


In this demo, step by step instructions are provided to deploy Apache Oozie on hadoop & how to execute a job through MapReduce in oozie.

  1. If we plan to install Oozie-4.0.1 or prior version JDK 1.6 required , if the jdk edition on Ubuntu is greater than or equal 1.7, then need to make changes in pom.xml file.
  2. If we install oozie-4.1.0 or later, then jdk 1.7 is fine
  3. Mapreduce job history server need to be configured & started successfully & remaining hadoop & yarn daemons should be running fine..
  4. Hadoop should be running, i.e hdfs, mapreduce, yarn services should be running fine..install hadoop 2.6.0 is compatible with the version of oozie 4.1.0

5. In this video , I’ve depicted step by step guide on installation of Apache Oozie on hadoop cluster & starting Oozie web console.


Once, the oozie installation is done successfully, then start scheduling a Map-reduce job on hadoop cluster using oozie.

6. First, extract the Oozie-examples.tar.gz file

$ cd $OOZIE_HOME
$ tar -xvf oozie-examples.tar.gz

7. Next, Edit the job.properties file of oozie-examples directory.

$/usr/local/oozie/oozie-bin$ find examples/ -name “job.properties” -exec sed -i “s/localhost:8020/localhost:9000/g” ‘{}’ \;
$/usr/local/oozie/oozie-bin$ find examples/ -name “job.properties” -exec sed -i “s/localhost:8021/localhost:8032/g” ‘{}’ \;

8. Now, checkout the job.properties file located in the directory $OOZIE_HOME/examples/apps/map-reduce

Oozie-job.properties


9. Finally, copy the local files to HDFS , to start the MR jobs with Oozie.

$ hadoop fs -put examples examples

$ hdfs dfs -mkdir -p /user/oozieuser/examples/apps/map-reduce/lib

$hdfs dfs -copyFromLocal $HADOOP_HOME/share/hadoop/mapreduce/hadoop-mapreduce-examples-2.6.0.jar /user/oozieuser/examples/apps/map-reduce/lib/hadoop-mapreduce-examples-2.6.0.jar
$ cd /usr/local/oozie/oozie-bin/
$/usr/local/oozie/oozie-bin$ oozie job -oozie http://localhost:11000/oozie -config $OOZIE_HOME/examples/apps/map-reduce/job.properties -run
job: 0000000-150216182818445-oozie-user-W
:/usr/local/oozie/oozie-bin$

10. Once , you have submitted the job on mapreduce node scheduled through oozie, checkout the status of the job execution.

$ usr/local/oozie/oozie-bin$ oozie job -oozie http://localhost:11000/oozie -info 0000000-150216182818445-oozie-user-W
$ usr/lib/oozie/oozie-bin$ oozie job -oozie http://localhost:11000/oozie -log 0000000-150216182818445-oozie-user-W

Oozie-job-console

Deployment of Apache Hadoop 2.7.0 on Ubuntu Vivid 15.04 on Azure Linux VM


Recently, on april 21st, the first release of 2015 of Apache Hadoop is committed, the version 2.7.0 is came up as dev edition. Lots of new updates have added.

  • This release drops support for JDK6 runtime & works with JDK 7+ only.
  • This release is yet not ready for production use. But, production users should wait for 2.7.1/2.7.2 release.

In Hadoop common, first time it has got support for Azure Blob storage – blob as file system for Azure.

Other than that, Hadoop HDFS has got support for file truncate, support for quotas per storage type & support for files with variable-length blocks. For Yarn & MapReduce, some of the new pluggins are added like Yarn authorization made pluggable, global caching of YARN localized resources, ability to limit running MapReduce of a job.

Here goes a step by step guide on installation of Apache Hadoop 2.7.0 on Azure Linux Virtual Machine(Ubuntu 15.04) .


Hortonworks Data Platform Administration: Deployment of Hortonworks HDP 2.2 using Ambari 1.7, Ambari Views, add-ons & Configuration of Yarn Capacity & Fair Scheduler.


In HDP administration certification, one of major important task is to set up the deployment of HDP cluster using Apache Ambari either on-premise  or in any cloud vendor’s cluster(e.g Amazon EC2, Microsoft Azure or Google Cloud Platform). HDP deployment & administration facility is available using Apache Ambari on both AWS EC2 & Azure VM linux platform.

In this video, we provided step by step guidance on installation of HDP 2.2 using Ambari on AWS Elastic Cloud cluster platform large instance, since deploying version is HDP 2.2, along with the basic steps of VM image creation, password-less SSH authentication, setting up secure encryption (.pem) file, installation of Ambari on RHEL 6.5, configuration & starting the service before HDP installation.

The master & slave nodes are deployed into separate clusters & total seven (7) VM s are utilized for the demo.

https://onedrive.live.com/?cid=7f185b0e5a1ba82e&id=7F185B0E5A1BA82E%2136999&action=Share


In the next video, We have shown the latest updates of Ambari 1.7 on Hortonworks HDP 2.2 version clusters, Ambari views & several new add-ons which makes easy for configuration of Yarn Capacity schedulers & Yarn Fair Schedulers, job versioning concepts, easy addition of new hosts in the production cluster, downloading additional components of hive settings XML configuration file(e.g. hive-site.xml) on local system.


Detail sessions are available for candidates looking for Hortonworks HDP administration training(certifications). You can contact us if you are looking for an online instructor led real-world industry expert based training course.


Hadoop Administration: Installation scripts of Apache Hadoop (2.6.0) on Ubuntu Unicorn as Multi-Node cluster


Recently , just published a quick step by step guide on deployment of Apache Hadoop (2.6.0) single -node cluster on Ubuntu unicorn(14.10) image, you can get the full installation video here.


Here, the full deployment of Apache Hadoop (2.6.0) multi-node cluster setup details are provided. The primary hardward requirements are needed to run the setup :

1. VMware Player/Workstation(if Windows/Linux) or VMware Fusion(if OSX)

2. More than 4 GB of RAM for primary OS

3. More than 60 GB of Disk space

4. Intel VT-X capable processor.

5. Ubuntu/CentOs/Red Hat/Sese OS Image(as guest OS)

Now, the step by step multinode hadoop clustering  scripts are provided.


Checkout the Ipaddress of each master & slaves node:

$ifconfig

Namenode > hadoopmaster > 192.168.23.132

Datanodes > hadoopslave1 > 192.168.23.133
hadoopslave2 > 192.168.23.134
hadoopslave3 > 192.168.23.135

Clone Hadoop Single node cluster as hadoopmaster

Hadoopmaster Node

$ sudo gedit /etc/hosts

hadoopmaster   192.168.23.132
hadoopslave1   192.168.23.133
hadoopslave2   192.168.23.134
hadoopslave3   192.168.23.135

$ sudo gedit /etc/hostname

hadoopmaster

$ cd /usr/local/hadoop/etc/hadoop

$ sudo gedit core-site.xml

replace localhost as hadoopmaster

$ sudo gedit hdfs-site.xml

replace value as 3 (represents no of datanode)

          $ sudo gedit yarn-site.xml

add the following configuration

<configuration>
<property>
<name>yarn.resourcemanager.resource-tracker.address</name>
<value>hadoopmaster:8025</value>
<property>
<property>
<name>yarn.resourcemanager.scheduler.address</name>
<value>hadoopmaster:8030</value>
<property>
<property>
<name>yarn.resourcemanager.address</name>
<value>hadoopmaster:8050</value>
<property>
</configuration>

$ sudo gedit mapred-site.xml.template
replace mapreduce.framework.name as mapred.job.tracker

replace yarn as hadoopmaster:54311

$ sudo rm -rf /usr/local/hadoop/hadoop_data

Shutdown hadoopmaster node

Clone Hadoopmaster Node as hadoopslave1, hadoopslave2, hadoopslave3

Hadoopslave Node (conf should be done on each slavenode)

$ sudo gedit /etc/hostname

hadoopslave<nodenumberhere>

          $ sudo mkdir -p /usr/local/hadoop/hadoop_data/hdfs/datanode

$ sudo chown -R trainer:trainer /usr/local/hadoop

          $ sudo gedit /usr/local/hadoop/etc/hadoop/hdfs-site.xml

remove dfs.namenode.dir property section

reboot all nodes

Hadoopmaster Node

          $ sudo gedit /usr/local/hadoop/etc/hadoop/masters

hadoopmaster

$ sudo gedit /usr/local/hadoop/etc/hadoop/slaves

remove localhost and add

hadoopslave1
hadoopslave2
hadoopslave3

$ sudo gedit /usr/local/hadoop/etc/hadoop/hdfs-site.xml

   remove dfs.datanode.dir property section

          $ sudo mkdir -p /usr/local/hadoop/hadoop_data/hdfs/namenode

$ sudo chown -R trainer:trainer /usr/local/hadoop

$ sudo ssh-copy-id -i ~/.ssh/id_dsa.pub trainer@hadoopmaster

$ sudo ssh-copy-id -i ~/.ssh/id_dsa.pub trainer@hadoopslave1

$ sudo ssh-copy-id -i ~/.ssh/id_dsa.pub trainer@hadoopslave2

$ sudo ssh-copy-id -i ~/.ssh/id_dsa.pub trainer@hadoopslave3

$ ssh hadoopmaster

$ exit

$ ssh hadoopslave1

$ exit

$  ssh hadoopslave2

$ exit

$ ssh hadoopslave3

$ exit

$ hadoop namenode -format

$ start-all.sh

$ jps (check in all 3 datanodes)


for checking Hadoop web console :

http://hadoopmasteripaddress :8088/
http://hadoopmasteripaddress :50070/
http://hadoopmasteripaddress :50090/

http://hadoopmasteripaddress  :50075/


Installation Commands of Apache Hadoop 2.6.0 as Single Node Pseudo-Distributed mode on Ubuntu 14.10 (Step by Step)


$ sudo apt-get update

$ sudo apt-get install default-jdk

$ java -version

$ sudo apt-get install ssh

$ sudo apt-get install rsync

$ ssh-keygen -t dsa -P ‘ ‘ -f ~/.ssh/id_dsa

$ cat ~/.ssh/id_dsa.pub >> ~/.ssh/authorized_keys

$ wget -c http://mirror.olnevhost.net/pub/apache/hadoop/common/current/hadoop-2.6.0.tar.gz

$ sudo tar -zxvf hadoop-2.6.0.tar.gz

$ sudo mv hadoop-2.6.0 /usr/local/hadoop

$ update-alternatives –config java

$ sudo gedit ~/.bashrc

#Hadoop Variables
export JAVA_HOME=/usr/lib/jvm/java-7-openjdk-amd64
export HADOOP_HOME=/usr/local/hadoop
export PATH=$PATH:$HADOOP_HOME/bin
export PATH=$PATH:$HADOOP_HOME/sbin
export HADOOP_MAPRED_HOME=$HADOOP_HOME
export HADOOP_COMMON_HOME=$HADOOP_HOME
export HADOOP_HDFS_HOME=$HADOOP_HOME
export YARN_HOME=$HADOOP_HOME
export HADOOP_COMMON_LIB_NATIVE_DIR=$HADOOP_HOME/lib/native
export HADOOP_OPTS=”-Djava.library.path=$HADOOP_HOME/lib”

Now apply the variables.

$ source ~/.bashrc

There are a number of xml files within the Hadoop folder that require editing which are:

  • mapred-site.xml
  • yarn-site.xml
  • core-site.xml
  • hdfs-site.xml
  • hadoop-env.sh

The files can be found in /usr/local/hadoop/etc/hadoop/.First copy the mapred-site template file over and then edit it.

mapred-site.xml

mapreduce-xml

Next, go to the following path.

$ cd /usr/local/hadoop/etc/Hadoop

Add the following text between the configuration tabs.

mapred-site.xml.template

<property>
<name>mapreduce.framework.name</name>
<value>yarn</value>
</property>

yarn-site.xml

Add the following text between the configuration tabs.

<property>
<name>yarn.nodemanager.aux-services</name>
<value>mapreduce_shuffle</value>
</property>

core-site.xml

Add the following text between the configuration tabs.
<property>
<name>fs.default.name</name>
<value>hdfs://localhost:9000</value>
</property>

hdfs-site.xml

Add the following text between the configuration tabs.

<property>
<name>dfs.replication</name>
<value>1</value>
</property>

<property>
<name>dfs.name.dir</name>
<value>file:///home/hadoopuser/hadoopspace/hdfs/namenode</value>
</property>

<property>
<name>dfs.data.dir</name>
<value>file:///home/hadoopuser/hadoopspace/hdfs/namenode/datanode</value>
</property>

Note other locations can be used in hdfs by separating values with a comma, e.g.

file:/home/hadoopuser/hadoopspace/hdfs/datanode, .disk2/Hadoop/datanode, . .

hadoop-env.sh

Add an entry for JAVA_HOME

export JAVA_HOME=/usr/lib/jvm/jre-1.7.0-openjdk.x86_64/

export JAVA_HOME=/usr/lib/jvm/java-7-openjdk-amd64

$ mkdir -p /home/hadoopuser/hadoopspace/hdfs/namenode

$ mkdir -p /home/hadoopuser/hadoopspace/hdfs/datanode

$ sudo chown hadoopuser:hadoopuser -R /usr/local/hadoop

Next format the namenode.

hdfs-format

Issue the following commands.

./start-dfs.sh
./start-yarn.sh

StartDemons

Issue the jps command and verify that the following jobs are running:

jps

At this point Hadoop has been installed and configured

type on terminal ,

firefox http://localhost:50070(namenode)

firefox http://localhost:50075(datanode)

firefox http://localhost:50090(checkpoint namenode)

firefox http://localhost:8088(Yarn Cluster)

Hadoop-namenode

MapReduce